An asset turnover ratio formula compares the total amount of a company’s net sales in dollar amount to the total amount of asset that was utilized to generate the stated amount of net sales. Hence, the asset turnover ratio is a ratio that compares a company’s net sales to the total assets through which this sale was generated. This metric is used to measure how efficiently the assets of a company are deployed to generate revenue or sales.
The asset turnover ratio calculations are mostly done on an annual basis and a higher ratio is usually preferred because it means the company is using its assets well enough to generate its net sales or revenue.
In this article, we will discuss the asset turnover ratio formula, calculations, and interpretation.
Related: Types of Profitability Ratios and Formulas
Asset turnover ratio Meaning
The asset turnover ratio is an efficiency ratio that measures the value of a company’s sales or revenues relative to the value of its assets. The asset turnover ratio formula is used to evaluate the ability of a company to generate sales from its assets by comparing the company’s net sales with its average total assets. This ratio can be used as an indicator of a company’s efficiency in using its assets to generate revenue. That is, it shows how efficiently a company can use its assets to generate sales.
This ratio is also called the total asset turnover ratio because it calculates a company’s net sales as a percentage of its average total assets to show how many sales are generated from each dollar of the company’s assets. For example, an asset turnover ratio of 0.5 would mean that each dollar of the company’s assets generates 50 cents of sales.
The efficiency of a company can be analyzed by tracking the company’s asset turnover ratio over time. As the company grows, the asset turnover ratio measures how efficiently the company is expanding over time, especially when compared to its competitors. As the total revenue of a company is increasing, the asset turnover ratio can still identify whether the company is becoming more or less efficient at using its assets effectively to generate profits.
See also: Income Statement Ratios Formulas and Examples
Asset turnover ratio formula
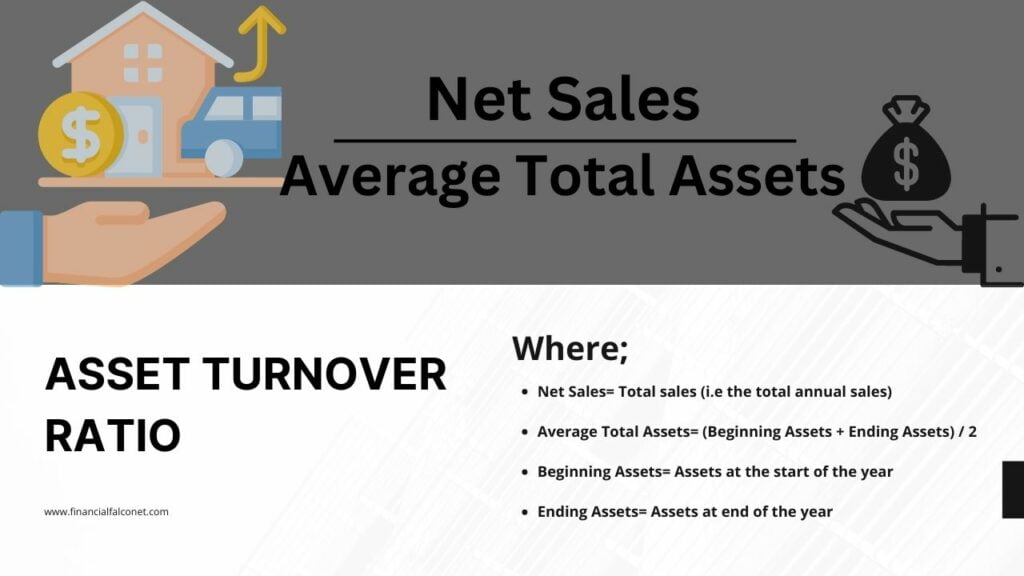
The asset turnover ratio formula compares a company’s net sales with its average total assets. Therefore, this ratio compares the performance from the income statement with the company’s financial health on the balance sheet. Hence, the formula for asset turnover ratio is expressed as:
Asset Turnover Ratio = Net Sales / Average Total Assets
Where;
- Net Sales= Total sales (i.e the total annual sales)
- Average Total Assets= (Beginning Assets + Ending Assets) / 2
- Beginning Assets= Assets at the start of the year
- Ending Assets= Assets at end of the year
That is:
Asset Turnover Ratio = Net Sales / [(Beginning Assets + Ending Assets) / 2]
Net Sales is the numerator in the asset turnover ratio formula, which is calculated as the total amount of revenue that is made by a company. It is the company’s gross sales from a specific period minus any sales returns and allowances, or sales discounts taken by customers. When comparing the asset turnover ratio of a company with another company, ensure that the net sales calculations are derived from the same accounting period.
Average total assets is the denominator in the formula for asset turnover ratio, which is gotten by taking the average of the beginning and ending assets of the period being analyzed. The standard asset turnover ratio formula considers all types of assets such as current assets, fixed assets, and other assets.
How to calculate the asset turnover ratio
The formula for asset turnover ratio compares a company’s net sales to its assets. Therefore, the asset turnover ratio calculation is done by dividing a company’s net sales by its average total assets. In order to determine the average total value of a company’s assets, first locate the value of the company’s assets on the balance sheet as of the start of the year. Then, locate the ending balance or value of the company’s assets at the end of the year.
When you get the beginning and ending value figures, add them and divide them by 2 to get the average total asset value for the year. After that, locate the company’s total sales on its income statement which could be listed also as Revenue. Then, to finally get the company’s asset turnover ratio, divide the total sales or revenue by the average value of the assets for the year.
The calculated asset turnover ratio is expressed as a rational number that may be a whole number or may include a decimal. Furthermore, by dividing the number of days in the year by the calculated asset turnover ratio, an investor can determine how many days it takes for a company to convert all of its assets into revenue. For instance, a company with an asset turnover ratio of 2.29 would mean that the company takes 159 days ( i.e 365 days/ 2.29) to convert all of its assets into revenue.
Related: Debt to EBITDA ratio formula and calculation
Asset turnover ratio interpretation
The asset turnover ratio interpretation is relevant when assessing the efficiency of a company. This ratio measures how effectively a company uses its assets to generate revenue or sales. Hence, the asset turnover ratio is used to compare a company’s dollar amount of sales or revenues to its total assets which measure the efficiency of the company’s operations. This means that the higher the asset turnover ratio, the more efficient a company is at generating revenue from its assets.
An asset turnover ratio interpretation of a higher value is generally favored because it is an indication that the company is more efficient in generating sales or revenue. On the other hand, a lower asset turnover ratio indicates that the company may not be using its assets efficiently. That is, if a company has a low asset turnover ratio, it may be an indication that it is not efficiently using its assets to generate sales. Generally, a low asset turnover ratio interpretation suggests problems with poor inventory management, surplus production capacity, and bad tax (or revenue) collection methods.
Nevertheless, it is important to note that asset turnover ratios vary throughout different sectors due to the varying nature of different industries. Hence, only the ratios of companies that are in the same sector should be compared. This means that the ratio is most effective when compared across similar companies. For instance, low-margin industries usually tend to have a higher asset turnover ratio compared to other industries. Therefore, it wouldn’t make sense to compare this ratio for businesses in different sectors.
As the asset turnover ratio varies from sector to sector, some industries tend to have a higher ratio while some tend to have a lower ratio. Publicly-facing industries such as retail and restaurants depend heavily on converting assets to inventory, then converting inventory to sales, thus, they tend to have a higher asset turnover ratio. Other business sectors like real estate usually take long periods of time to convert inventory into revenue. Hence, even though real estate transactions may result in high-profit margins, the industry-wide asset turnover ratio is usually low.
What is a good asset turnover ratio?
As earlier said, the asset turnover ratio varies so much between companies in different industries or sectors. Hence, there’s no universally defined figure that is considered a ‘good’ asset turnover ratio. For instance, in the retail sector, an asset turnover ratio of 2.5 or more could be considered a good ratio, whereas an asset turnover ratio that’s between 0.25 and 0.5 is more likely to be acceptable for a company in the utility sector.
This means that whether a company’s asset turnover ratio is good or poor would depend on its industry and the value of the ratio from the company’s previous records. Nevertheless, generally, an asset turnover ratio results that are higher than those in the same industry would indicate a company that is better at moving products to generate revenue.
If the asset turnover ratio is less than 1, it is not considered good for the company as it indicates that the company’s total assets cannot produce enough revenue at the end of the year. However, this depends on the average asset turnover ratio of the industry to which the company belongs. If the company’s industry has an asset turnover that is less than 0.5 in most cases and this company’s ratio is 0.9; then the company is doing well, irrespective of its low asset turnover.
Conversely, if the asset turnover ratio is greater than 1, it is considered good for the company as it indicates that the company can generate enough revenue for itself. However, this will also depend on the average asset turnover ratio of the industry to which the company belongs. For instance, let’s assume the company belongs to a retail industry where its total assets are usually kept low and as a result, most companies’ average ratio in the retail industry is usually over 2. Now, if in this case, the company has an asset turnover of 1.5, it is interpreted that the company is not doing well and the business owners need to think of restructuring in order to generate better revenues.
Nevertheless, a company’s management can attempt to make its efficiency seem better on paper than it actually is. For instance, selling off assets to prepare for declining growth has the effect of artificially inflating the asset turnover ratio. Hence, by selling off assets, companies can artificially inflate their asset turnover ratio.
This will improve the company’s asset turnover ratio in the short term because revenue (the numerator of the asset turnover ratio formula) increases as the company’s assets (denominator of the asset turnover ratio formula) decreases. However, this affects the company in the sense that it then has fewer resources to generate sales in the future. Also, changing depreciation methods for fixed assets can have a similar effect on the asset turnover ratio because it will change the accounting value of the firm’s assets.
See also: Equity Ratio Formula and Calculation
Asset turnover ratio calculations
Let’s look at some examples of asset turnover ratio calculations:
Asset turnover ratio example 1
Assume, Techbuddy is a tech start-up company that manufactures a new tablet computer. Say, the owner of the company is currently looking for new investors and has a meeting with an angel investor. The investor wants to know how well the company uses its assets to produce sales, so he asks for the company’s financial statements and highlights the items needed to evaluate the company’s efficiency.
Here is what the financial statements of Techbuddy reported:
- Beginning Assets: $50,000
- Ending Assets: $100,000
- Net Sales: $25,000
The angel investor plugs this data into the formula for asset turnover ratio:
Asset Turnover Ratio = Net Sales / Average Total Assets
Asset Turnover Ratio = $25,000 / [($50,000 + $100,000) / 2]
= $25,000 / ($150,000 / 2)
= $25,000 / $75,000
= 0.33
Asset turnover ratio Interpretation: From the calculation done, the company’s ratio is only 0.33. This means that for every dollar in assets, the company only generates 33 cents. The investor may interpret this as the start-up company not being very efficient with its use of assets.
Asset turnover ratio example 2
For our second example let’s calculate the asset turnover ratio for four companies in the telecommunication-utilities and retail sectors for FY 2020. We will be using the financial statements of Walmart Inc. (WMT), Target Corporation (TGT), AT & T Inc. (T), and Verizon Communications Inc. (VZ) for this asset turnover ratio example:
Asset turnover ratio calculation for Walmart Inc. (WMT)
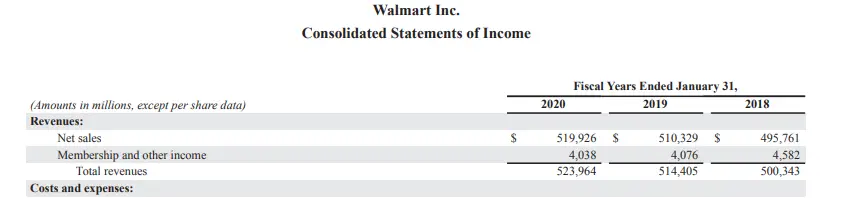
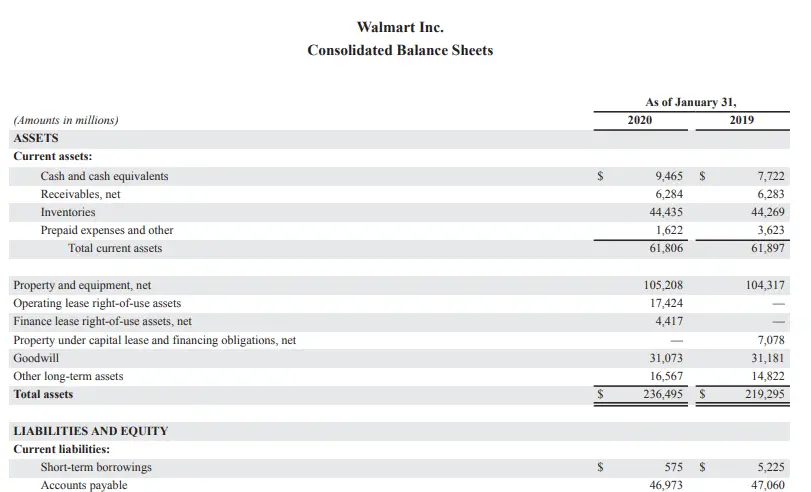
Here is what the financial statements of Walmart reported for FY 2020:
- Beginning Assets: $219,295 (Assets at the start of the year that was carried over from 2019)
- Ending Assets: $236,495 (Assets at the end of the year for 2020)
- Net Sales: $523,964 (Total revenue for 2020)
We will plug this data into the asset turnover ratio formula:
Asset Turnover Ratio = Net Sales / Average Total Assets
Asset Turnover Ratio = $523,964 / [($219,295 + $236,495) / 2]
= $523,964 / $227,895
= 2.29
Asset turnover ratio calculation for Target Corporation (TGT)
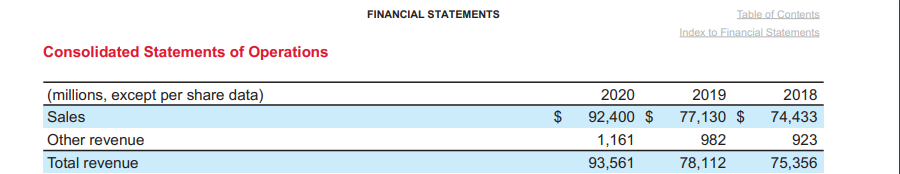
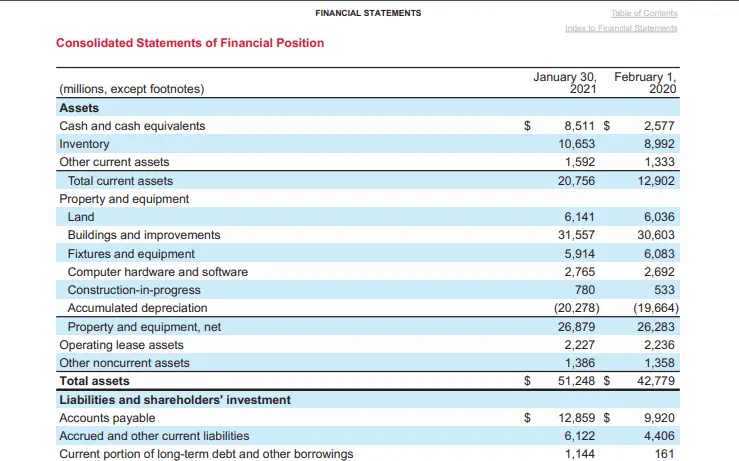
Here is what the financial statements of Target Corporation reported for FY 2020:
- Beginning Assets: $42,779 (Assets at the start of the year that was carried over from 2019)
- Ending Assets: $51,248 (Assets at the end of the year for 2020)
- Net Sales: $93,561 (Total revenue for 2020)
We will plug this data into the asset turnover ratio formula:
Asset Turnover Ratio = Net Sales / Average Total Assets
= $93,561 / [($42,779 + $51,248) / 2]
= $93,561 / $47,014
= 1.99
Asset turnover ratio calculation for AT & T Inc. (T)
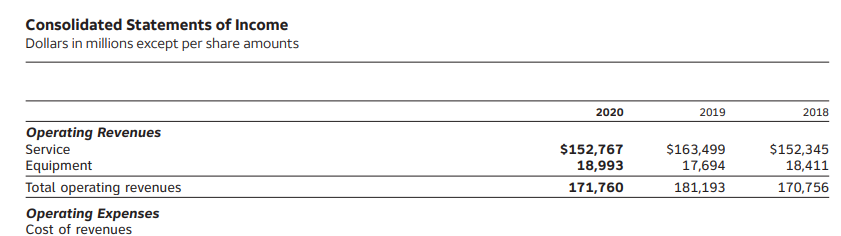
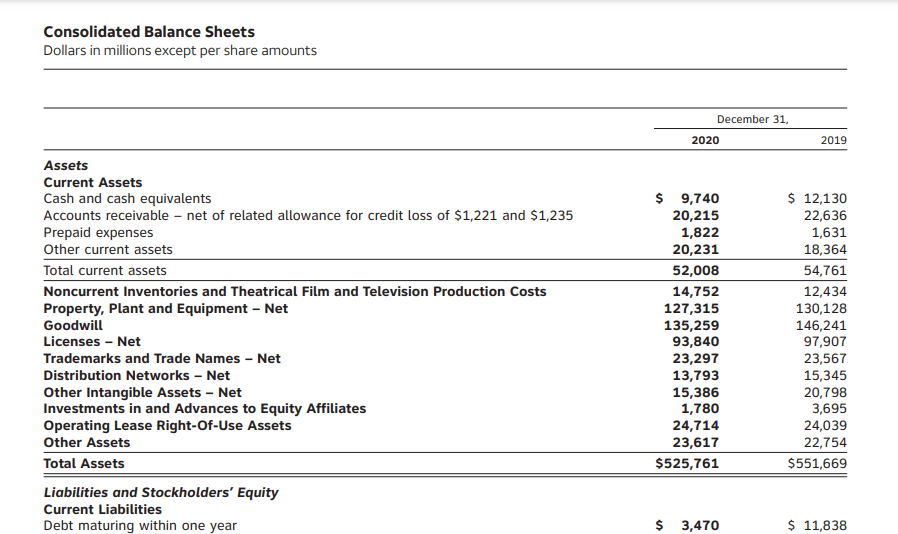
Here is what the financial statements of AT & T reported for FY 2020:
- Beginning Assets: $551,669 (Assets at the start of the year that was carried over from 2019)
- Ending Assets: $525,761 (Assets at the end of the year for 2020)
- Net Sales: $171,760 (Total operating revenues for 2020)
We will plug this data into the asset turnover ratio formula:
Asset Turnover Ratio = Net Sales / Average Total Assets
= $171,760 / [($551,669 + $525,761) / 2]
= $171,760 / $538,715
= 0.31
Asset turnover ratio calculation for Verizon Communications Inc. (VZ)
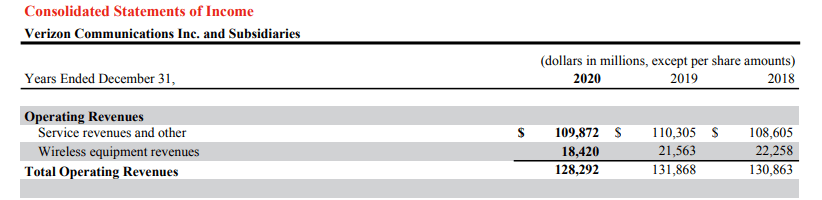
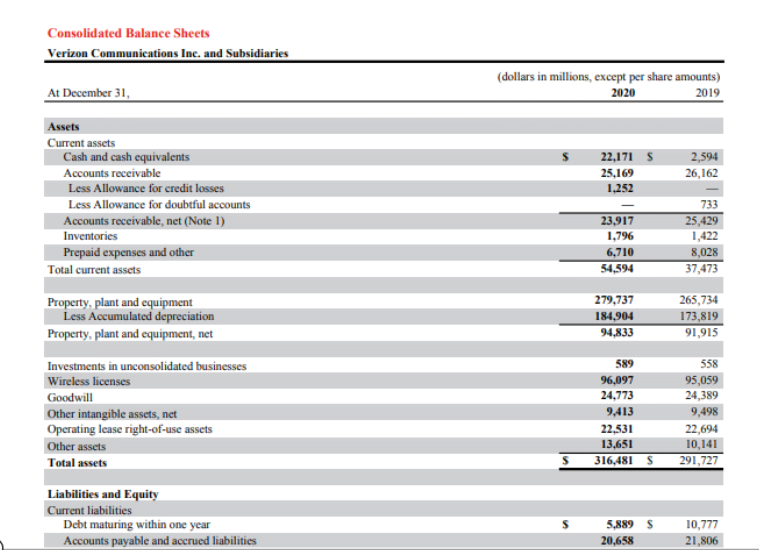
Here is what the financial statements of Verizon Communications Inc. reported for FY 2020:
- Beginning Assets: $291,727 (Assets at the start of the year that was carried over from 2019)
- Ending Assets: $316,481 (Assets at the end of the year for 2020)
- Net Sales: $128,292(Total operating revenues for 2020)
We will plug this data into the asset turnover ratio formula:
Asset Turnover Ratio = Net Sales / Average Total Assets
= $128,292 / [($291,727 + $316,481) / 2]
= $128,292 / $304,104
= 0.42
Comparing the asset turnover ratio calculation for Walmart, Target, AT & T, and Verizon
| Walmart | Target | AT & T | Verizon | |
|---|---|---|---|---|
| Revenue (in $ million) | $523,964 | $93,561 | $171,760 | $128,292 |
| Average Total Assets (in $ million) | $227,895 | $47,014 | $538,715 | $304,104 |
| Asset turnover ratio | 2.29 | 1.99 | 0.31 | 0.42 |
Asset turnover ratio Interpretation: From the calculation done, Walmart, Target, AT & T, and Verizon had an asset turnover ratio of 2.29, 1.99, 0.31, and 0.42 respectively. We can see that AT&T and Verizon both have an asset turnover ratio of less than one, which is actually acceptable for companies in the telecommunications-utilities sector. A low asset turnover ratio is acceptable for this sector because companies in this industry have large asset bases, and it is expected that they would slowly turn over their assets through sales.
The asset turnover ratio is most useful when compared across similar companies. Hence, it would not make sense to compare the asset turnover ratios for Walmart and AT&T, since they operate in very different industries. Therefore, comparing the asset turnover ratios for AT&T with Verizon is acceptable and provides a better estimate of which company is using its assets more efficiently in the industry. We can see from the calculation that Verizon has a higher ratio than AT& T which indicates that it turns over its assets at a faster rate than AT&T.
Furthermore, we can compare the asset turnover ratio of Walmart with Target because they are in the same retail industry. Publicly-facing industries such as retail and restaurants depend heavily on converting assets to inventory, then converting inventory to sales, thus, they tend to have a higher asset turnover ratio. This explains why Walmart and Target’s asset turnover is higher than Verizon and AT &T for the same year.
From the calculation done, it is seen that for every dollar in assets, Walmart generated $2.29 in sales, while Target generated $1.99. Target’s turnover is low when compared to Walmart’s and its industry’s average asset turnover ratio. This could be an indication that the retail company was experiencing sluggish sales or holding obsolete inventory.
Also, Target’s low turnover may also mean that the company uses ineffective tax collection methods. The firm may have a long collection period which results in higher accounts receivable. However, it could also mean that Target, Inc. may not be using its assets efficiently. The firm’s fixed assets such as property or equipment could be sitting idle or not being utilized to their full capacity.
Asset turnover ratio calculation example 3
For our third example, we will be calculating the asset turnover ratio for Nestle, one of the world’s largest food and beverage companies.
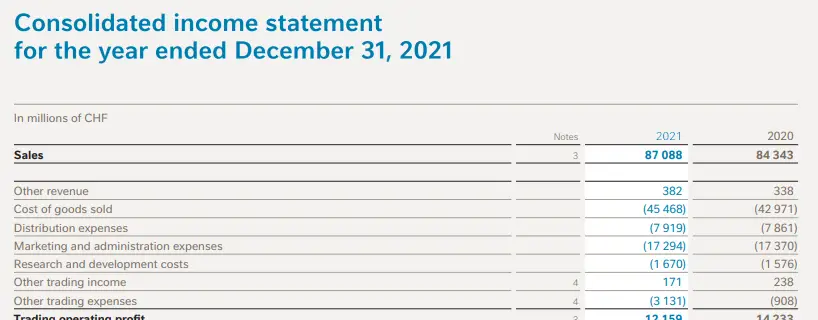
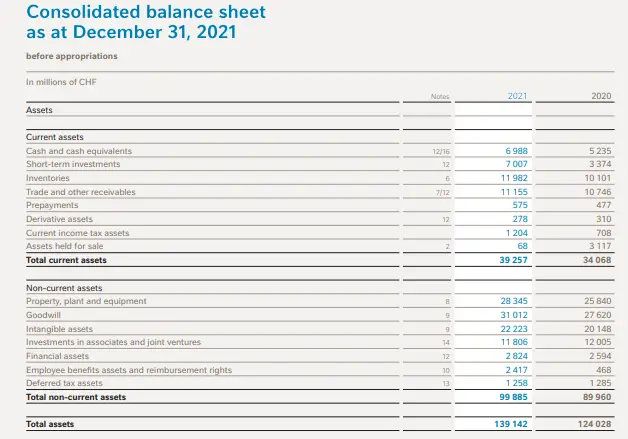
Here is what the financial statements of Nestle reported for FY 2021:
- Beginning Assets: $124,028
- Ending Assets: $139,142
- Net Sales: $87,088
We will plug this data into the asset turnover ratio formula:
Asset Turnover Ratio = Net Sales / Average Total Assets
Asset Turnover Ratio = $87,088 / [($124,028 + $139,142) / 2]
= $87,088 / ($131,585 / 2)
= $87,088 / $65,793
= 1.32
Asset turnover ratio Interpretation: From the calculation done, Nestle’s asset turnover ratio is 1.32. The asset turnover ratio is greater than 1, which is considered a good ratio for the company as it indicates that the company is efficiently using its assets to generate enough revenue. This means that for every dollar in assets, the company generates $1.32.
Related: Financial leverage ratios and formula
Limitations of using the Asset Turnover Ratio formula
The asset turnover ratio formula is used to calculate and measure how efficiently the assets of a company are used to generate revenue or sales. However, there are a few limitations to using the asset turnover ratio formula. In as much as the asset turnover ratio formula should be used to compare similar companies, when it comes to stock analysis the metric does not provide all the necessary and helpful details.
Also, it is possible that the asset turnover ratio of a company in any single year would differ substantially from previous or subsequent years. Hence, investors should review the trend in the asset turnover ratio over time to evaluate whether the company’s use of assets is improving or deteriorating.
Another limitation or challenge with using the asset turnover ratio formula is that the ratio may be artificially deflated when a company makes large asset purchases in anticipation of higher growth. Similarly, selling off assets to prepare for declining growth will artificially inflate the asset turnover ratio. In addition, several other factors such as seasonality can affect the asset turnover ratio of a company during accounting periods shorter than a year.
Last Updated on November 4, 2023 by Nansel Nanzip Bongdap
Obotu has 2+years of professional experience in the business and finance sector. Her expertise lies in marketing, economics, finance, biology, and literature. She enjoys writing in these fields to educate and share her wealth of knowledge and experience.