The DuPont formula is a financial management tool that is used to analyze the ability of a company to increase its return on equity. Hence, it can be said that this tool is based on the calculation of the return on equity ratio. That is to say, this framework analyzes the return on equity ratio to explain how businesses can improve their returns to investors.
In this article, we will look at the DuPont formula and how it is used to solve practical equations in a modern business setting. Also, we will take a closer look at how DuPont analysis is being done. But before we start explaining the formula, let’s get an understanding or a general overview of what DuPont analysis is.
What is DuPont analysis?
This is a financial model that was developed to examine and analyze the return on equity of a business. By doing so, investors can concentrate on each of the important financial performance metrics individually to find the strengths and weaknesses of a business or company.
This financial model was created in 1914 by F. Donaldson Brown, who at then was an employee of DuPont Corporation. In his model or formula, earnings, investments, and working capital are all combined to produce a single number he termed return on investment (ROI). The formula was later adopted by other businesses and turned into a benchmark for all departments at DuPont.
This model is important in assessing the individual components of a company’s ROE, and the information gotten from the analysis can be used by an investor to compare the operational effectiveness of two companies that are similar. Another importance of the DuPont analysis is to implore it to find the strengths or weaknesses of the financials of a company that needs to be fixed.
Components of DuPont
The Dupont analysis examines three major components of the ROE ratio as listed below.
- Profit margin
- Total asset turnover
- Financial leverage
By dividing this framework (DuPont) into these three components, one can assess how well one can manage the company’s assets, expenses, and debt. Thus, we will briefly explain these components below.
Profit margin
Profit margin is a metric for determining profitability. It reflects a company’s pricing strategies as well as how well it controls costs. The profit margin is calculated by taking the net profit and dividing it by the total revenue. As one feature of the DuPont equation, increasing a company’s profit margin means that every sale brings more money, resulting in a higher overall return on equity.
For example, if company X has an annual net profit of $100,000 and revenue or turnover of $1,000,000, the net profit margin will be expressed as:
Net Profit Margin = Net Profit/Total Revenue = 100,000/1,000,000 = 10%
Total asset turnover
Asset turnover is a financial ratio that assesses the effectiveness with which a business uses its assets to produce sales revenue or sales income. Asset turnover is more common in businesses with low-profit margins than it is in those with high-profit margins. Similar to profit margin, a company will produce more sales per asset owned if asset turnover rises, which will again lead to a higher overall return on equity.
For instance, if company A has an average of $200 in assets and $10,000 in revenue, the asset turnover will be calculated like this:
Asset Turnover = Revenues/Average Assets = 1000/200 = 5
Financial leverage
Financial leverage is the difference between the amount of equity a company uses and the amount of debt it uses to finance its operations. Increased financial leverage will also increase return on equity, as it did with asset turnover and profit margin. This is due to the fact that a company will have higher interest payments which are tax deductible if it uses debt financing more frequently. Maintaining a high percentage of debt in a company’s capital structure results in a higher return on equity because dividend payments are not tax deductible.
For instance, if company Z has average assets of $1,000 and equity of $400, the company’s leverage will be determined as follows:
Financial Leverage = Average Assets/Average Equity = 1000/400 = 2.5
In summary;
- The profit margin reveals how effectively a company’s management runs operations and manages costs.
- Asset turnover gauges how well a business generates sales for every dollar invested in assets.
- The financial leverage or equity multiplier calculates the number of funding that investors have contributed for each dollar of assets to determine how leveraged a company is.
Now that we have an understanding of the analysis of DuPont, we can now proceed to discuss the formula of DuPont and how it is used in real-life equations.
Read also: Equity stocks
DuPont Formula
The formula for DuPont analysis is based on two models. The first is the 3-step model and the second is the 5-step model. These two models will be explained below.
3-step model
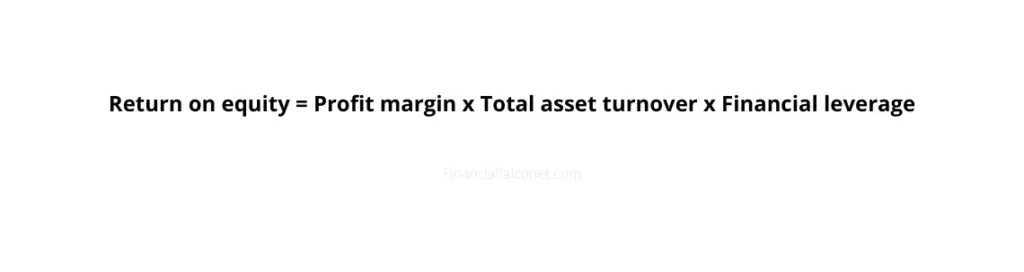
To calculate your ROE in a three-step DuPont analysis, multiply your net profit margin ratio by your total asset turnover ratio by your financial leverage ratio (called your equity multiplier). This is equivalent to multiplying the net income/sales revenue ratio by the sales revenue/average total assets ratio by the average total assets/average shareholders’ equity ratio.
Mathematically it can be written as follows:
5-step model
This model enables investors to determine whether a company is boosting its ROE by amassing debt while suffering from a low-profit margin and/or depreciating assets.
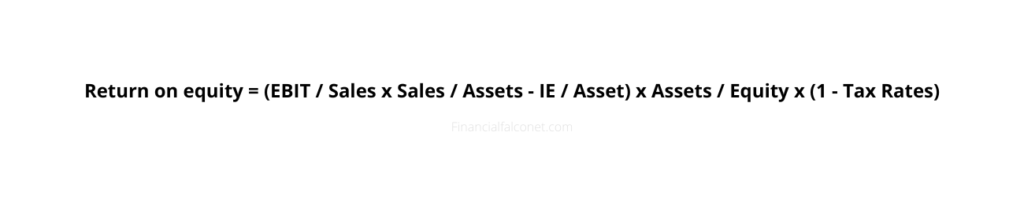
In the 5-step model, individual calculations for asset efficiency and financial leverage remain unchanged, but the net profit margin formula used to calculate operational efficiency changes to better reflect a company’s earnings before interest and taxes, or EBIT.
EBIT is calculated by deducting earnings before taxes (EBT) from interest expenses (IE).
The remainder of the equation is then multiplied by one minus the tax rate to calculate the tax hit on a company.
The five-step Dupont equation is written as follows:
DuPont formula explanation
We’ll be able to understand how the two formulas work if we break it down.
- The net profit margin is the first component in this formula and the profit margin is calculated as Net Income / Revenues.
- Total asset turnover is the formula’s second component and if we look at the total asset turnover formula, it is Revenues / Total Assets.
- The third component is the Equity Multiplier and when we look at the financial leverage factor formula, we get Total Assets / Shareholders’ Equity.
Now, if we combine these three components as determined by DuPont Corporation, we will get
Return on Equity = Profit Margin * Total Asset Turnover * Leverage Factor Alternatively, Return on Equity = Net Income / Revenues / Total Assets / Shareholders’ Equity
The magic of this formula is that when we multiply these three, we get Net Income / Shareholders’ Equity. However, if we examine each separately, we will be able to comprehend the total four ratios and what they bring as listed below.
- First, we will learn about the company’s profitability.
- Second, we will be able to determine how effectively the company has used its assets.
- Third, how much leverage a company has accumulated.
- Fourth, we will examine the overall return on equity.
Note: We include preferred shares and dividends in the return on equity formula in addition to common shares.
The essence of the two formulas
Instead of focusing on a single straightforward ratio, the three- and five-step equations both offer a deeper insight into a firm’s ROE by looking at what is changing within a company. As with any financial statement ratio, it is always a good idea to compare them to the company’s past and to its rivals.
For instance, if two companies are compared side by side, one can have a lower ROE and by using the five-step method, you may determine why this is lower. It might be that the company is poorly managed and has too little leverage; This scenario will make creditors view the company as riskier and charge it higher interest rates. Another case in point might be that the company has greater costs that reduce its operating profit margin.
Using the DuPont formulas to identify sources like these as earlier stated improves an investor’s understanding of the business and how it ought to be valued.
Related: Equity Ratio
DuPont formula example
Example 1 in using the equation of DuPont
An investor is considering two companies in the same industry. The investor wishes to use the DuPont analysis method to compare the strengths and areas of opportunity of each company in order to determine which company is the better investment option. They begin by compiling the following financial data for each company:
| Company 1 | Company 2 | |
| Net income | $2000 | $2500 |
| Revenue | $8000 | $20000 |
| Average assets | $5000 | $8000 |
| Average equity | $2000 | $1000 |
The investor then performs the following calculations to obtain the numbers required for each component of the DuPont analysis formula:
Net profit margin
The net profit margins of each company are calculated by the investor using their net income and revenue:
Net Profit Margin = Net Profit/Total Revenue
Therefore,
- Company one’s net profit margin= $2,000 / $8,000 = 0.25
- Company two’s net profit margin= $2,500 / $20,000 = 0.125
Total asset turnover
The investor computes total asset turnover using each company’s revenue and average assets:
Total Asset Turnover = Revenues/Average Assets
Thus,
- Company one’s total asset turnover= $8,000 / $5,000 = 1.6
- Company two’s total asset turnover= $20,000 / $8,000 = 2.5
Financial leverage or equity multiplier
The investor computes the equity multiplier using the average assets and average equity of each company:
Financial Leverage = Average Assets/Average Equity
Hence,
- Company one’s equity multiplier= $5,000 / $2,000 = 2.5
- Company two’s equity multiplier= $8,000 / $1,000 = 8
Return on equity
Finally, using the DuPont analysis formula, the investor uses the figures from each of their previous calculations to calculate each company’s return on equity:
ROE = Profit Margin × Asset Turnover × Financial Leverage
Therefore,
- Company one’s DuPont analysis ROE= 0.25 x 1.6 x 2.5 = 1
- Company two’s DuPont analysis ROE= 0.125 x 2.5 x 8 = 2.5
The DuPont analysis model shows that, while company two has a higher return on equity ratio than company one, a large portion of company two’s ROE is due to its equity multiplier. The investor can also see that company one’s 25% net profit margin accounts for a large portion of its ROE ratio. As a result of this information, the investor decides to invest in company one.
Example 2
The financial overviews of organization X can be summarized as follows:
| Organization x | |
| Net income | $87,000 – $15000 = $72000 |
| Net sales | $420,000 |
| Total assets | $473,000 |
| Total shareholders equity | $358,000 |
Organization X has agreed to pay dividends of 15,000 dollars. Profit distributions should be subtracted from net income. Based on the information provided above, the three components are calculated as follows:
Net Profit Margin = Net Profit/Total Revenue
Net Profit Margin = (87,000-15,000)/420,000 x 100% = 17.14%
Total Asset Turnover = Revenues/Average Assets
Total Asset Turnover = 420,000/473,000 = 0.89
Financial Leverage = Average Assets/Average Equity
Financial Leverage = 473,000/358,000 = 1.32
ROE = Profit Margin × Asset Turnover × Financial Leverage
According to the DuPont formula, Organization X’s Return on Equity is:
ROE = 17.14% x 0.89 x 1.32 = 20.14%
Organization X has an ROE of 20.14%. This means that Organization X generates $0.14 for every dollar invested. This is an important number for potential investors because it shows how effectively a company uses its money to increase its net income.
Example 3
Now consider Walmart (WMT). The company reported the following for the fiscal year ending January 31, 2021:
| Walmart finance | |
| Net income | $4.75 billion |
| Revenue | $559.2 billion |
| Assets | $252.5 billion |
| Shareholders’ equity | $80.9 billion |
So, based on these figures, we can deduce that the company possessed the following:
Net Profit Margin = Net Profit/Total Revenue
Net Profit Margin = 4.75 billion / 559.2 billion = 0.0085 * 100% = 0.8%
Total Asset Turnover = Revenues/Average Assets
Total Asset Turnover = 559.2 / 252.5 = 2.22
Financial Leverage = Average Assets/Average Equity
Financial Leverage = 252.5 / 80.9 = 3.12
ROE = Profit Margin × Asset Turnover × Financial Leverage
ROE = 0.8 × 2.2 × 3.12 = 5.5%
Example 4
ABC Co. has the following financial information:
| ABC Co. financial information | |
| Net income | $50,000 |
| Revenues | $300,000 |
| Total assets | $900,000 |
| Shareholders’ Equity | $150,000 |
Calculate the return on equity of ABC Co.
Solution
ROE = Net Income / Revenues * Revenues / Total Assets * Total Assets / Shareholders’ Equity
ROE = 50,000 / 300,000 * 300,000 / 900,000 * 900,000/ 150,000
ROE = 0.16 * 0.33 * 6 = 0.317 * 100% = 31.68%
Therefore,
ROE = 31.68%
Example 5 using DuPont equation
Danny Ltd recorded the following information for the year 2020 – 2021.
| Danny Ltd | |
| Earnings before interest and tax (EBIT) | $1,200,000 |
| Net sales | $9,600,000 |
| Net assets | $6,500,000 |
| Gross assets | $7,000,000 |
| Equity share capital (shares of $10 each) | 5,000,000 |
Calculate the return on equity.
Solution
Profit margin = EBIT / Net sales
Profit margin = 1,200,000 / 9,600,000
Profit margin = 0.125
Asset turnover = Net sales / Gross total assets
Asset turnover = 9,600,000 / 7,000,000
Asset turnover = 1.371
Equity multiplier = Gross total asset / Total shareholders
Equity multiplier = 7,000,000 / 5,000,000
Equity multiplier = 1.400
Return on Equity(ROE) = EBIT / Total shareholders equity
ROE = 1,200,000 / 5,000,000
ROE = 0.240
Or using DuPont’s formula of ROE = profit margin * Asset turnover * Equity multiplier
Therefore,
ROE = 0.125 * 1.371 * 1.400
ROE = 0.240 * 100% = 24%
With a return of equity of 24%, Danny Ltd. is in a good financial sphere for investors to come in and invest with the company.
Also read: Stocks and shares
Analysis of DuPont
This model was created to examine ROE and the effects that various business performance metrics have on this ratio. As a result, investors are not expecting large or small output numbers from this model. Instead, they want to figure out what is causing the current ROE. For example, if investors are dissatisfied with a low ROE, management can use this formula to identify the source of the problem, which could be a lower profit margin, asset turnover, or poor financial leveraging.
Once the problem area has been identified, management can work to correct it or address it with shareholders. Some normal operations naturally reduce ROE, but this is no cause for concern among investors. Such kinds of operations are like accelerated depreciation that artificially lowers ROE in the early stages of a company or business. But this framework can be used to highlight this paper entry, even though it is meant not to sway an investor’s opinion against investing in the company.
What is a good DuPont ratio?
A good DuPont ratio will be anything from 20% and above. Because the higher your return on investment, the more investors you’ll attract.
Because investments in organizations with a return on equity (ROI) of 20% or higher are considered justified and solid investments. For example, Apple Inc.’s profitability (ROE) increased from 17.88% in 2005 to 36.07% in 2017. Investors are always cautioned to avoid companies with a negative ROE because they frequently face problems associated with excessive debt.
Pros and cons of using the DuPont formula
- The DuPont formula is an excellent tool for determining a company’s strengths and weaknesses. Each individual weak financial ratio in the model can be examined further to gain a better understanding of the underlying cause of that weakness.
- If peradventure the calculation of the three components of the DuPont formula reveals any flaws, management can take corrective action, such as improving cost control, asset management, or marketing. The goal of all of these measures is to raise the return on equity ratio.
- Investors can use DuPont analysis to evaluate alternative stock investments and compare why the ROEs of the stocks differ. This is accomplished by determining the effect of operating efficiency, asset utilization efficiency, and financial leverage on ROE.
- One drawback of this framework is that the financial overviews used to calculate the ROE may have been manipulated to conceal flaws. You must use accurate accounting data if you want to be certain that the results are correct.
- Another downside is that all financial ratio analysis methods are best suited for the financials of a single company. But this framework can only function well when comparing the profitability and efficiency of one organization to that of another of the same size and operating in the same industry.
DuPont analysis formula vs. simple ROE formula
The DuPont analysis formula, which offers insight into the specific performance indicators that support ROE in the organization, is more thorough than the straightforward returns on equity formula. Meanwhile, a company’s ROE ratio can be determined using a straightforward method. Unlike the DuPont analysis formula, which illustrates how each element’s impact on the company’s current ROE ratio varies.
Additionally, this allows for the identification of corporate prospects and strengths, as well as the choice of which areas need to be changed in order to raise business ROE. The purpose of the DuPont model for investors is to help them make smarter investment selections by comparing the strength and field of opportunity for a similar company’s ROE ratio in great detail. Because averages for each component vary depending on the industry, it is crucial to evaluate the company in relation to its rivals.
Related: Return on assets formula: ROA calculation
Use of DuPont formula
- DuPont analysis is regarded as an effective tool for forecasting future changes in Return On Net Operating Assets (RNOA).
- It allows for the comparison of industry groups as a standard measure, provided that the industry groups use the same measure.
- It is a method for analyzing businesses by examining the interrelationships between various performance measures.
- DuPont analysis aids in identifying the factors that boost profits.
- By identifying these factors, one can attempt to improve the enterprise’s efficiency.
Limitations of DuPont formula
- It is a short-term measurement before taxes.
- It has no relationship with the cost of capital, the time value of money, or the value itself.
- Setting a goal for a good Return on capital employed (ROCE) is difficult.
- Using the gross value of assets as a measure rather than the net value is contrary to accounting principles and standards.
Read on: Debt to capital ratio
Conclusion
A simple return on equity calculation may be simple and informative, but it does not provide the entire picture. If a company’s ROE is lower than that of its competitors, the three- or five-step DuPont formula can help identify where the company is falling short. This framework can also shed light on how a company raises or maintains its ROE. In essence, the DuPont formula, equation, and analysis contribute significantly to a better understanding of a company’s return on equity.
Last Updated on November 2, 2023 by Nansel Nanzip Bongdap
Nansel is a serial entrepreneur and financial expert with 7+ years as a business analyst. He has a liking for marketing which he regards as an important part of business success.
He lives in Plateau State, Nigeria with his wife, Joyce, and daughter, Anael.