An income statement lists a company’s revenues, expenses, losses, and profits. The statement typically covers a period of time, such as one fiscal quarter or year. It can be used to assess a company’s financial health and determine its profitability. It is also known as the profit and loss statement (P&L). In this article, we are going to take an in-depth analysis of this type of financial statement: the income statement examples, accounts (or line items), how to prepare it, its uses, and then we see how the P&L statement differs from other financial statements such as the balance sheet, cash flow statement, and the statement of retained earnings. But what is an income statement?
What is an income statement?
An income statement is a financial statement that outlines the income and expenditure of a company over a period of time. It is also known as a profit and loss statement (P&L), the statement of revenue and expense. It can show the revenue, gains, expenses, and any loss incurred during the period covered by the financial statement. For example, the P&L statement can outline the year-over-year revenue over many years, including any losses, expenses, gains, etc, during the said period.
The income statement will present vital information to investors to make a decision on a company; it can show whether a business is generating a profit or not; from the P&L statement, you can also know if a firm spends more than it earns. Other financial statements that present reports about a firm’s financial performance include the cash flow statement and the balance sheet.
An income statement would not include accounts such as assets, liabilities, and equity (these are found on the balance sheet). Also, an income statement would not include unrealized gains from investments and loans (such would be reported in the cash flow statement).
Which accounts are found on an income statement?
The P&L statement has the following accounts or items: revenue, costs of goods sold (COGS), gross profit, selling expenses, general and administrative expenses, depreciation/ amortization, other expenses and income, research & development (R&D) expenses, taxes paid, and net profit. We will discuss each of these accounts on the profit and loss statement in the following sections.
Is income statement same as profit and loss?
An income statement is also known as a profit and loss statement (P&L), a profit and loss account, or a statement of profit or loss.
Other income statement names
The income statement is also called a revenue statement, earnings statement (or statement of earnings), operating statement, statement of financial performance, statement of financial result, statement of net income, or statement of operations.
Why a statement of profit or loss is important
The income statement will present information that investors can use to predict the future performance of a company. It helps a business to make decisions on the business strategy to adopt.
The revenue statement shows the current financial health of a company from the income and expenses recorded. The more the revenue compared to expense and loss, the more financially healthy a company is.
A company with a negative net income on the income statement shows it has more debts than revenue and this means it is not financially healthy.
Therefore, the income statement will present all the income and expenses of a firm over a given period; hence, it is also known as the statement of revenue and expenses.
Why income statement is prepared
Preparing income statements helps investors to make a choice on which business is best to invest in it. A company that meets its goals or exceeds its targets would be preferred by investors over one that always misses the targets.
The business owner can clearly see if a business’s revenue is increasing or decreasing. This can help to change or improve the marketing strategies.
What is a statement of comprehensive income?
A statement of comprehensive income is a financial statement that shows a company’s total revenue and expenses for a period of time together with revenues and expenses that are yet to be earned or realized. This statement provides a more complete picture of a company’s financial health than a traditional statement of revenue and expenses, which only covers revenue and expenses from operations.
The statement of comprehensive income includes all sources of revenue and expense, including investing and financing activities. Unrealized gains from investments are recorded in the statement of comprehensive income; the same applies to losses.
Example of statement of comprehensive income
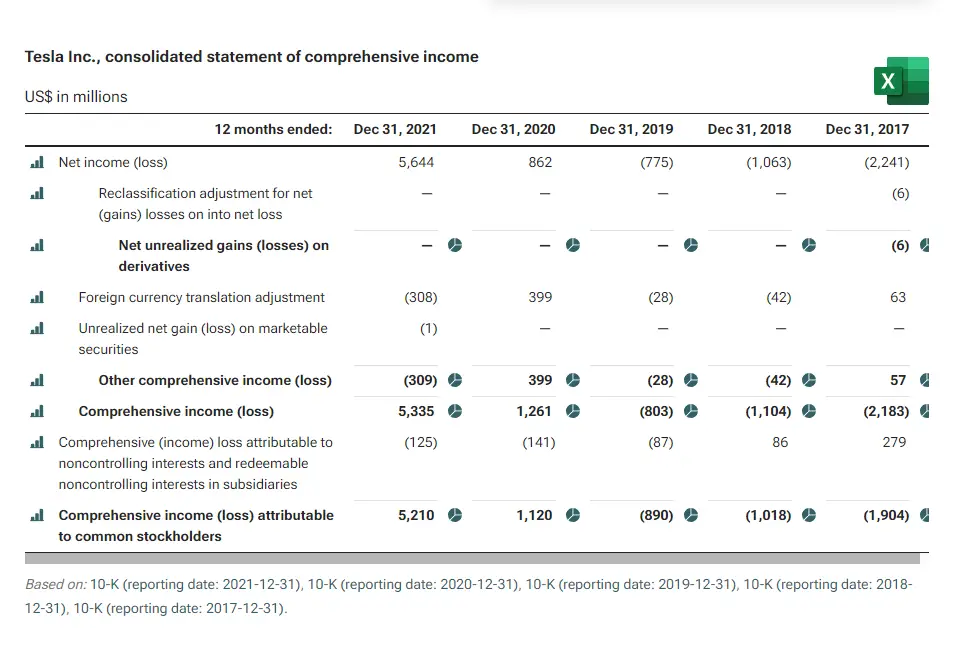
Source: https://www.stock-analysis-on.net/
Income Statement Classification
There are different formats of income statements, classified based on the names of the accounts or the function and uses. Below are the different classes of revenue statement.
Partial income statement
A partial income statement is a financial statement that shows only certain revenue and expenses. It’s usually used to give an idea of an aspect of a company’s financial health. For example, a partial income statement might show total revenue, total expenses, and net income only.
Since it doesn’t represent the complete income, the partial income statement are often not for external uses and auditors don’t certify them.
For example, it may be used to show how much revenue a firm made last year in order to estimate how much it can make in the current year.
Contribution margin income statement
The contribution margin income statement is a type of revenue statement that reports the financial transactions based on how fixed or variable each line item is, instead of classifying the accounts based on their uses or functions as done in the traditional profit and loss statement. This means the contribution income statement would display expenses as fixed expenses or variable expenses instead of the cost of goods sold, bad debt expenses, R&D expenses, utilities expenses, etc.
In general, the contribution margin income statement simply shows the contribution of the total revenue in covering the fixed cost after the variable cost has been deducted.
Contribution Margin Income Statement Format
| Onyx Kitchen and Foods Company | ||
| Contribution Income Statement for the Year Ended 31 Dec 2021. | ||
| Amount ($) | Total Amount ($) | |
| Revenue | ||
| Sales | 10,000 | |
| Other income | 2,000 | 12,000 |
| Less: Variable Costs | ||
| Wages | 3,500 | |
| Materials | 1,700 | 5,200 |
| Contribution Margin (Revenue Variable Cost) | 6,800 | |
| Less: Fixed Costs | ||
| Rent | 500 | |
| Insurance | 500 | 1,000 |
| Net Income (Contribution Margin - Fixed Cost) | 5,800 | |
The contribution margin formula can be expressed as Contribution Margin = Net Sales Revenue – Variable Costs.
When the variable cost is deducted from the sales revenue, we have the contribution margin. The contribution margin, therefore, is the money that is left after deducting the variable costs from the sales revenue.
In order to get the net income on the contribution margin income statement, the fixed cost has to be deducted from the contribution margin.
Hence, the net income formula from the contribution revenue statement can also be expressed as Net Income = Contribution margin – Fixed Cost.
Importance of the contribution margin
The contribution margin is important in determining the price to sell a product. If the fixed price for manufacturing a product is high, then the contribution margin has to be high enough to cover the fixed price and still have some money remaining as profit. If this condition is not met, then the company cannot be profitable.
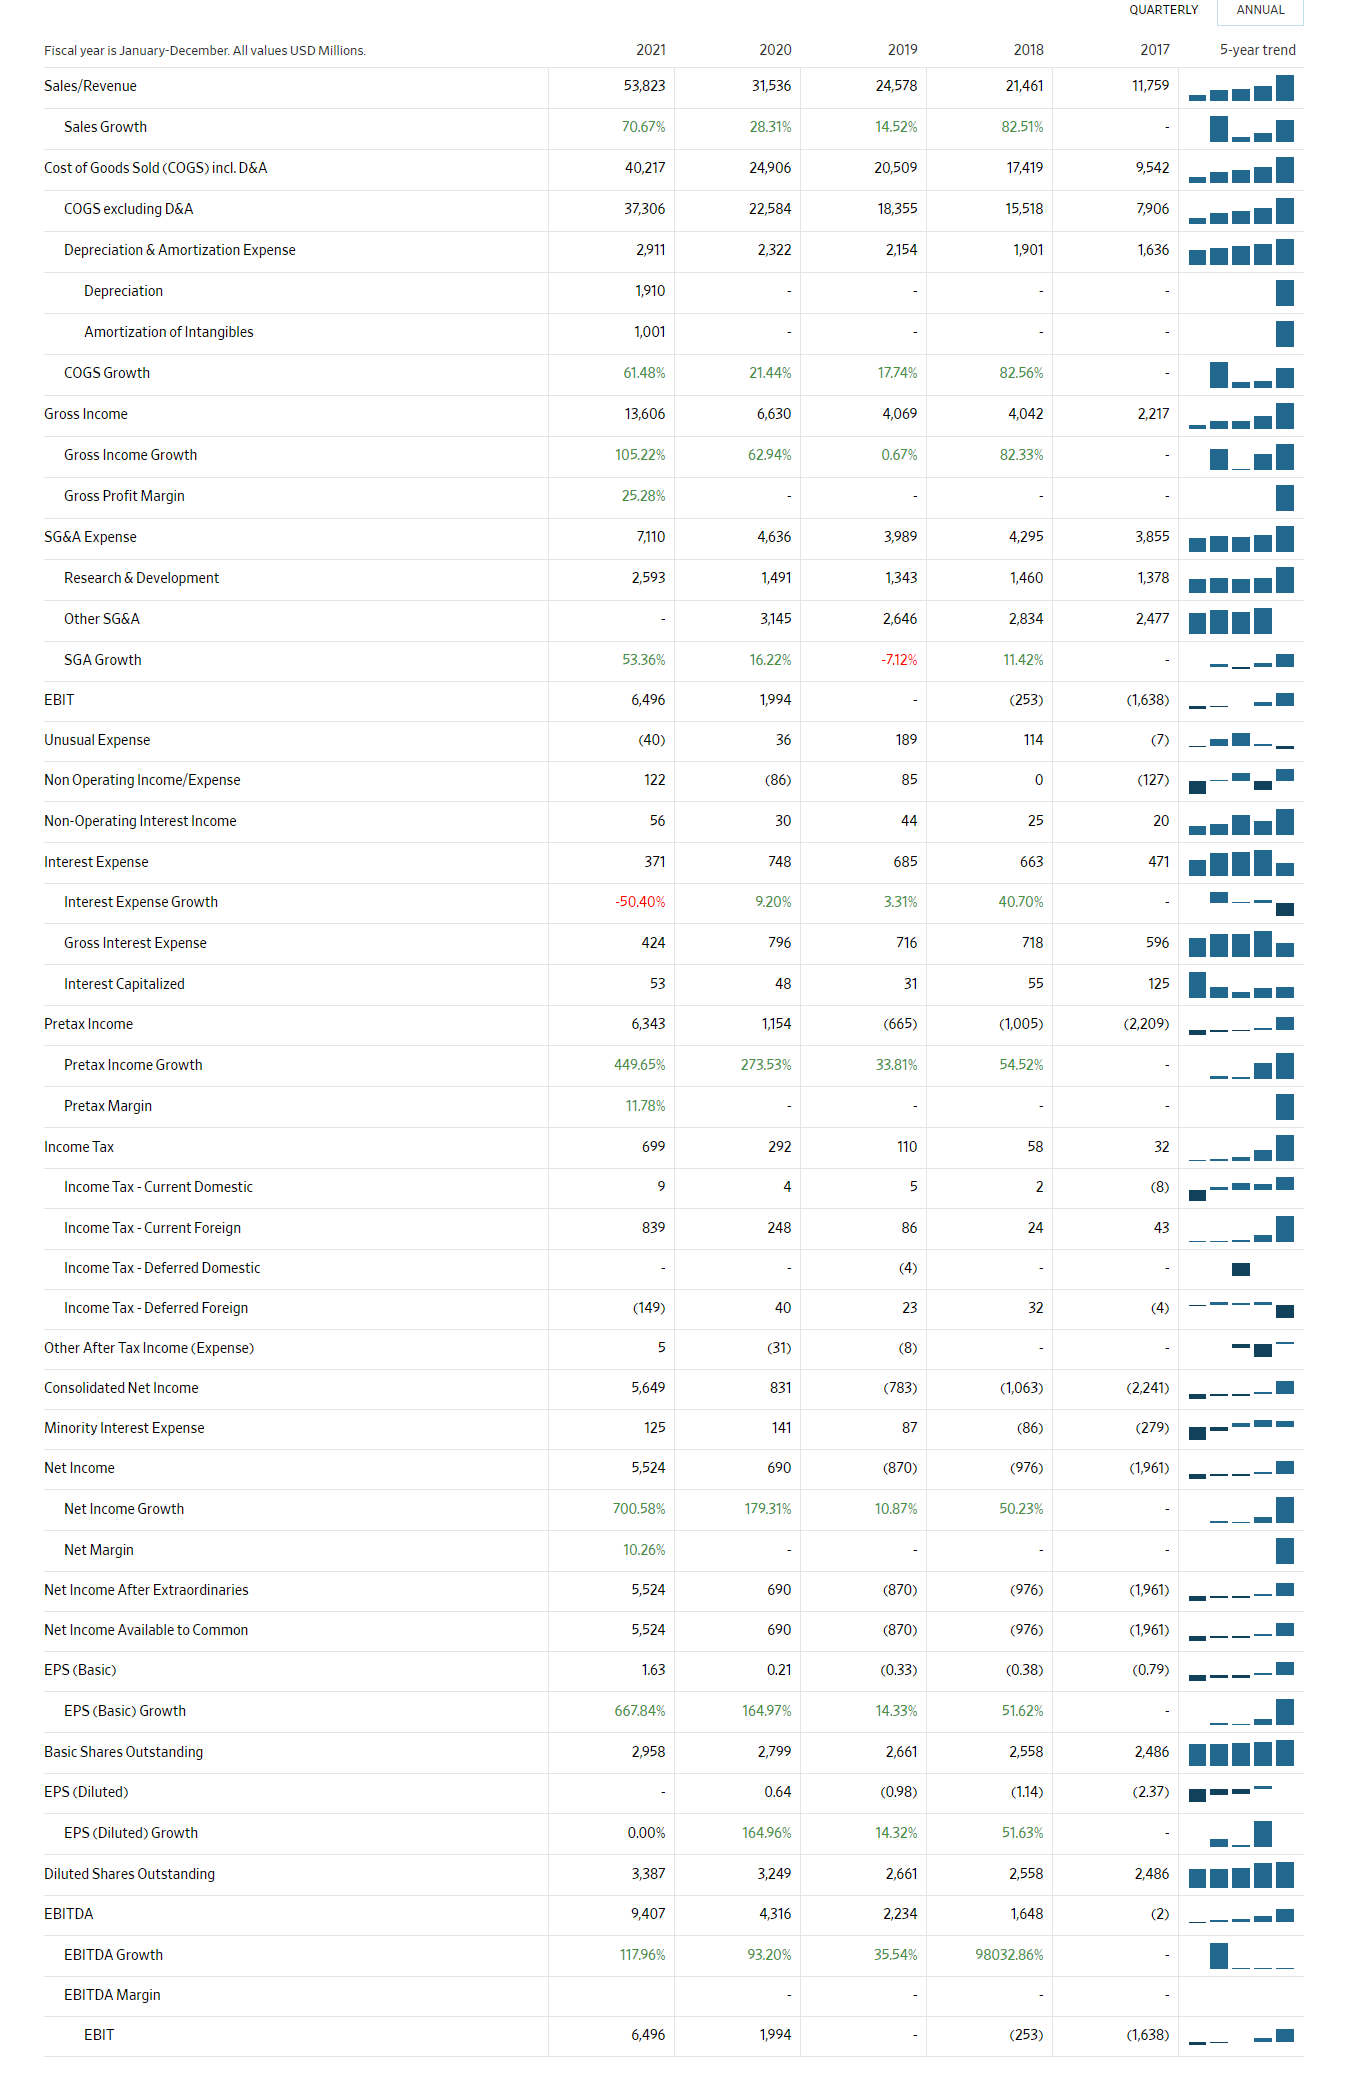
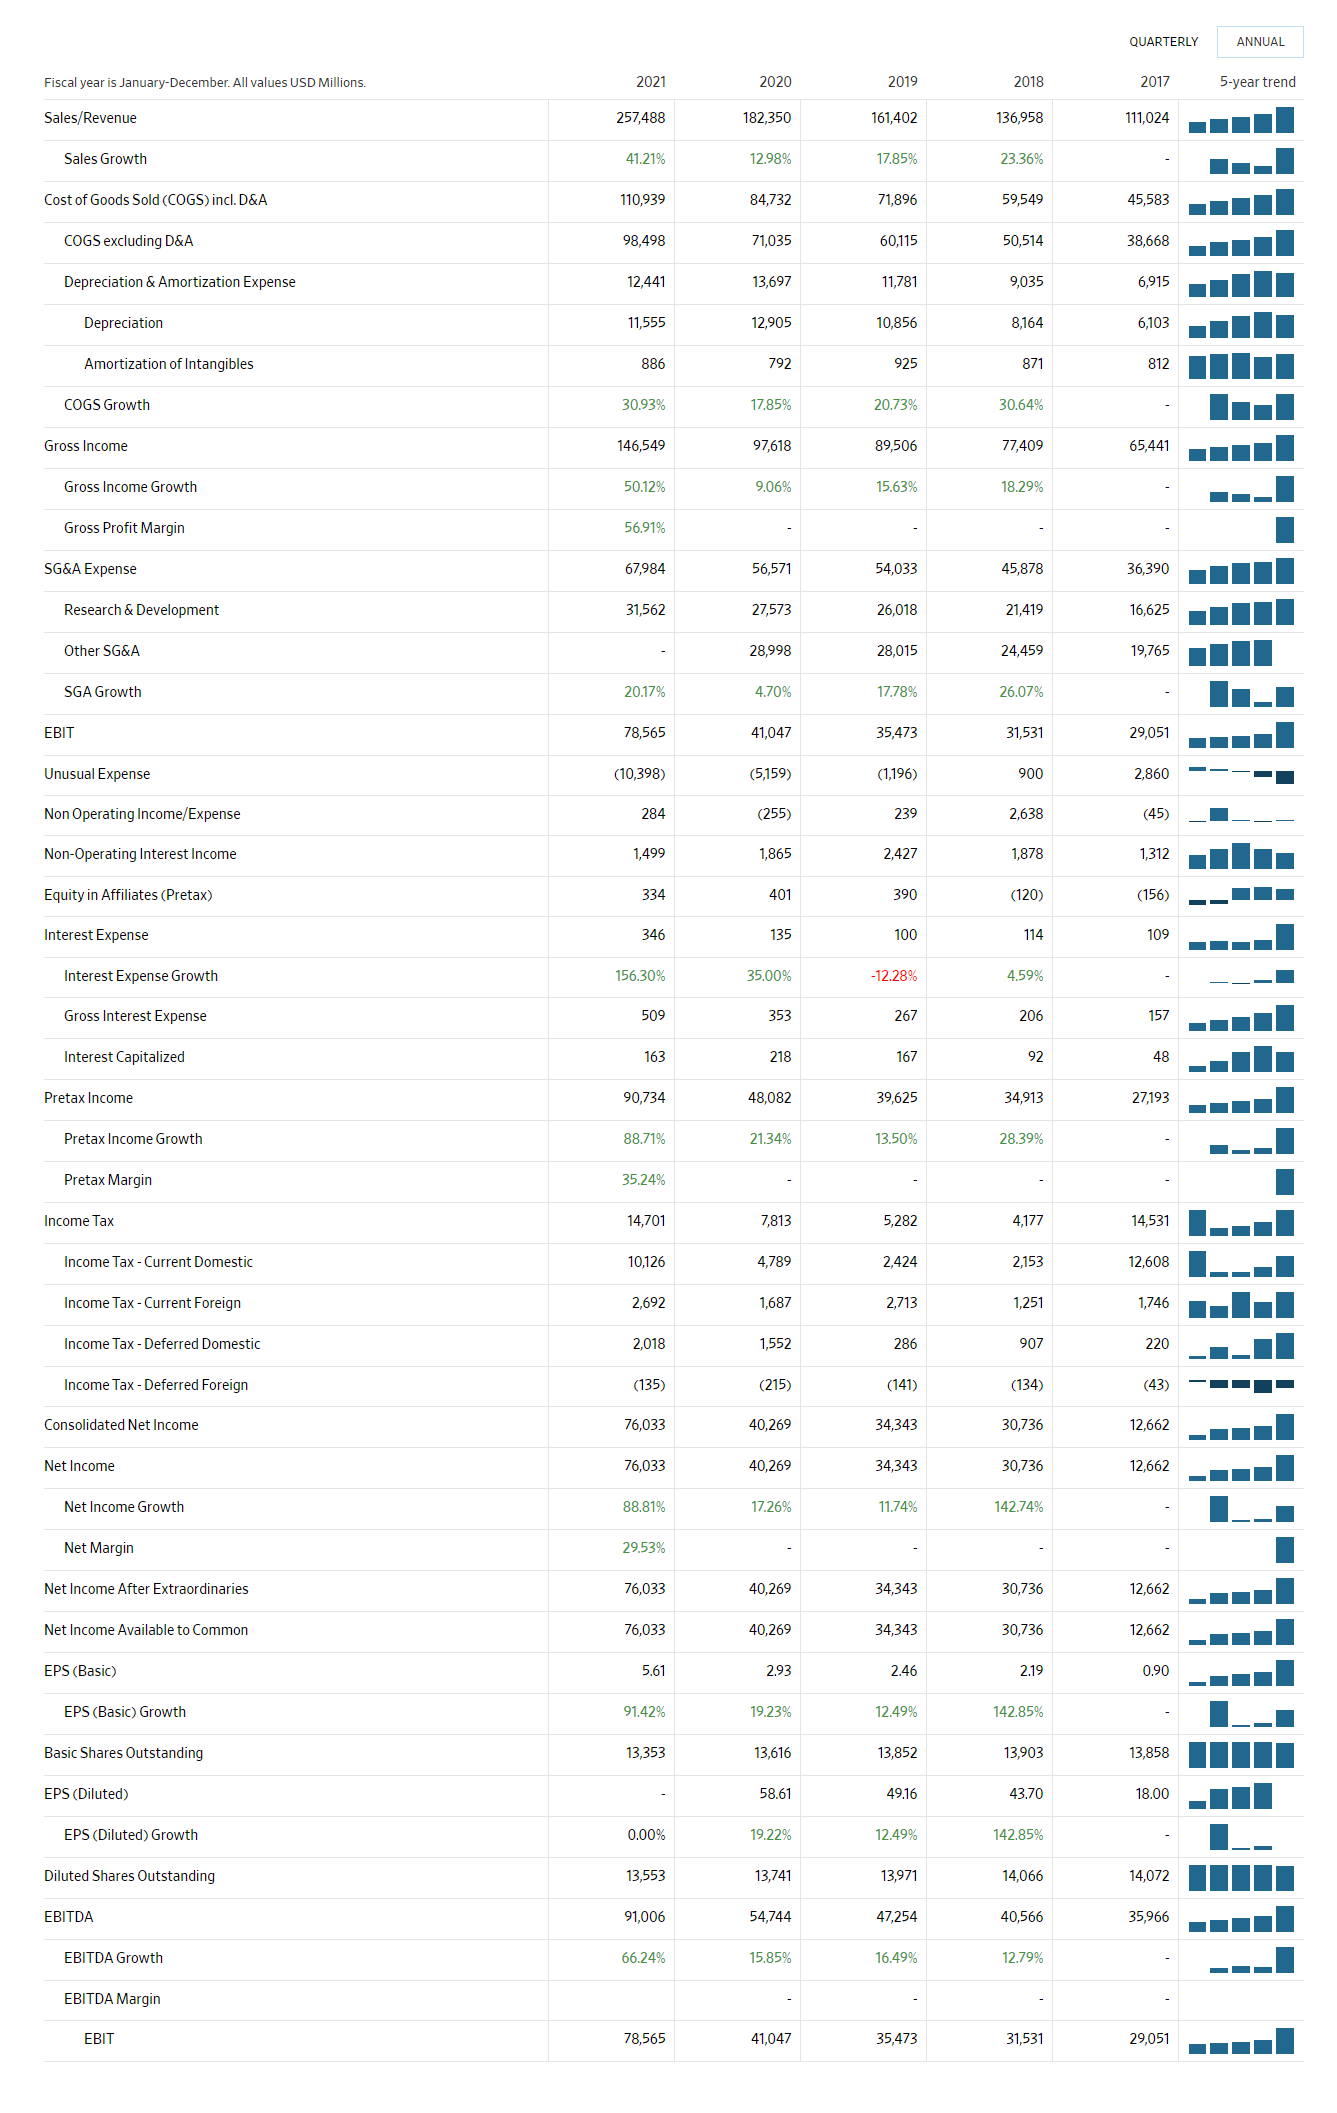
Comparative income statement
To better understand the financial performance of a company, it is best to compare multiple statements of earnings. That means comparing the earnings statement of one year with other years will give a better report than simply using a single profit and loss statement. A comparative income statement as the name suggests reports the profit and loss statement of several reporting periods. For example, a comparative income statement could report the earnings statement from 2020, 2021, and 2022 – this is a yearly comparative income statement; or it could report the profit and loss of the company quarterly such as in March, June, September, and December.
What is comparative income statement?
A comparative income statement is a single profit and loss statement that shows multiple income and expenses from previous reporting periods. It compares different statement of operations to give a clue whether there is progress or not. It helps the management of a company to know what is working and what is not.
Therefore, a comparative income statement can give a trend of income and expenses of the company, to know whether income is increasing or not; and also shows whether the loss is increasing or not.
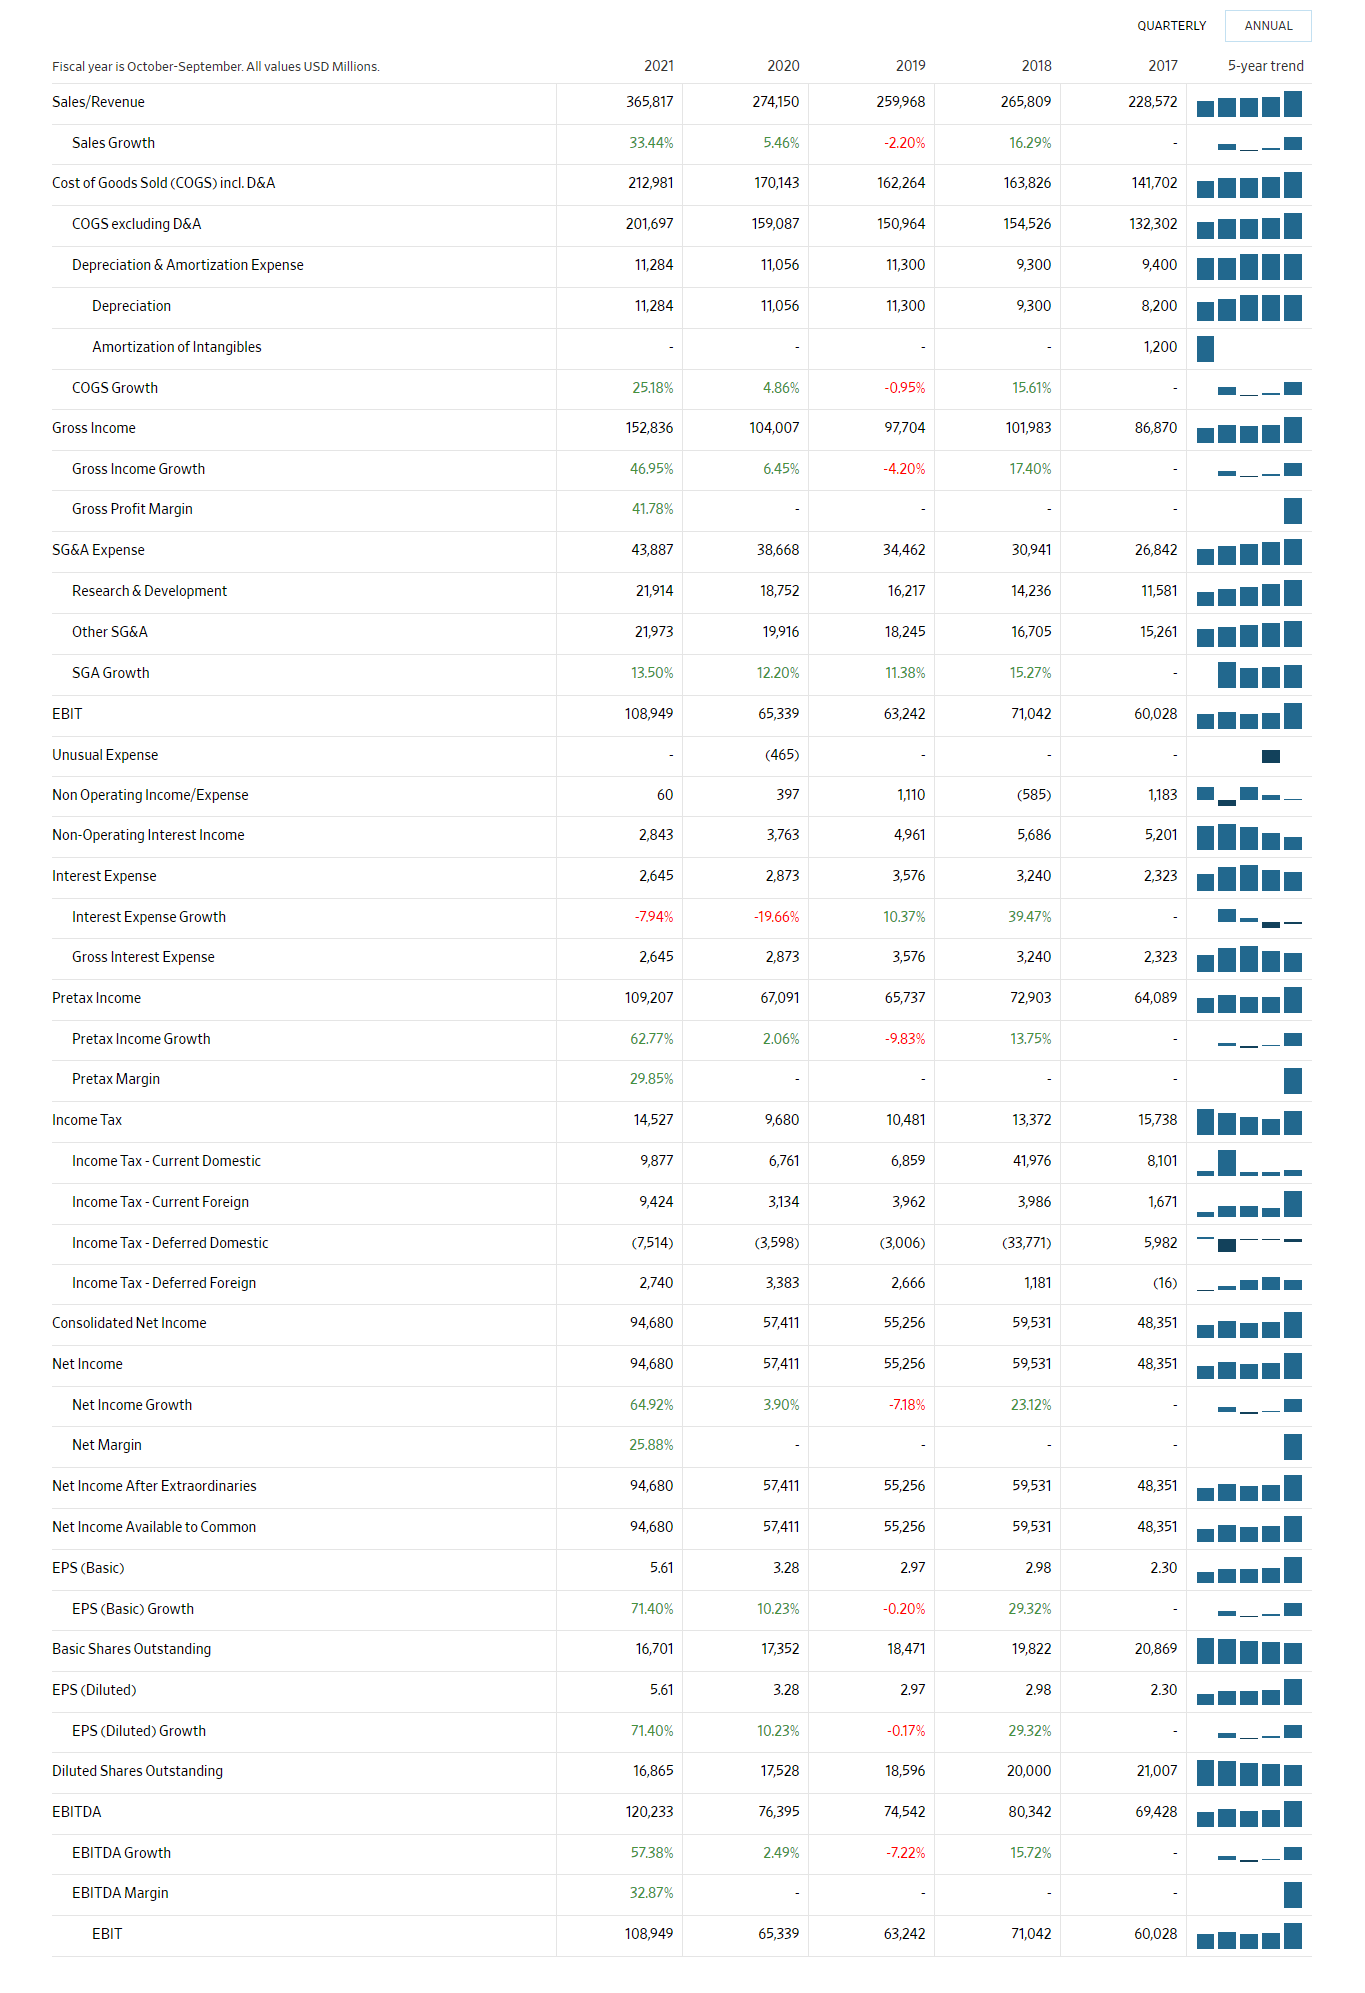
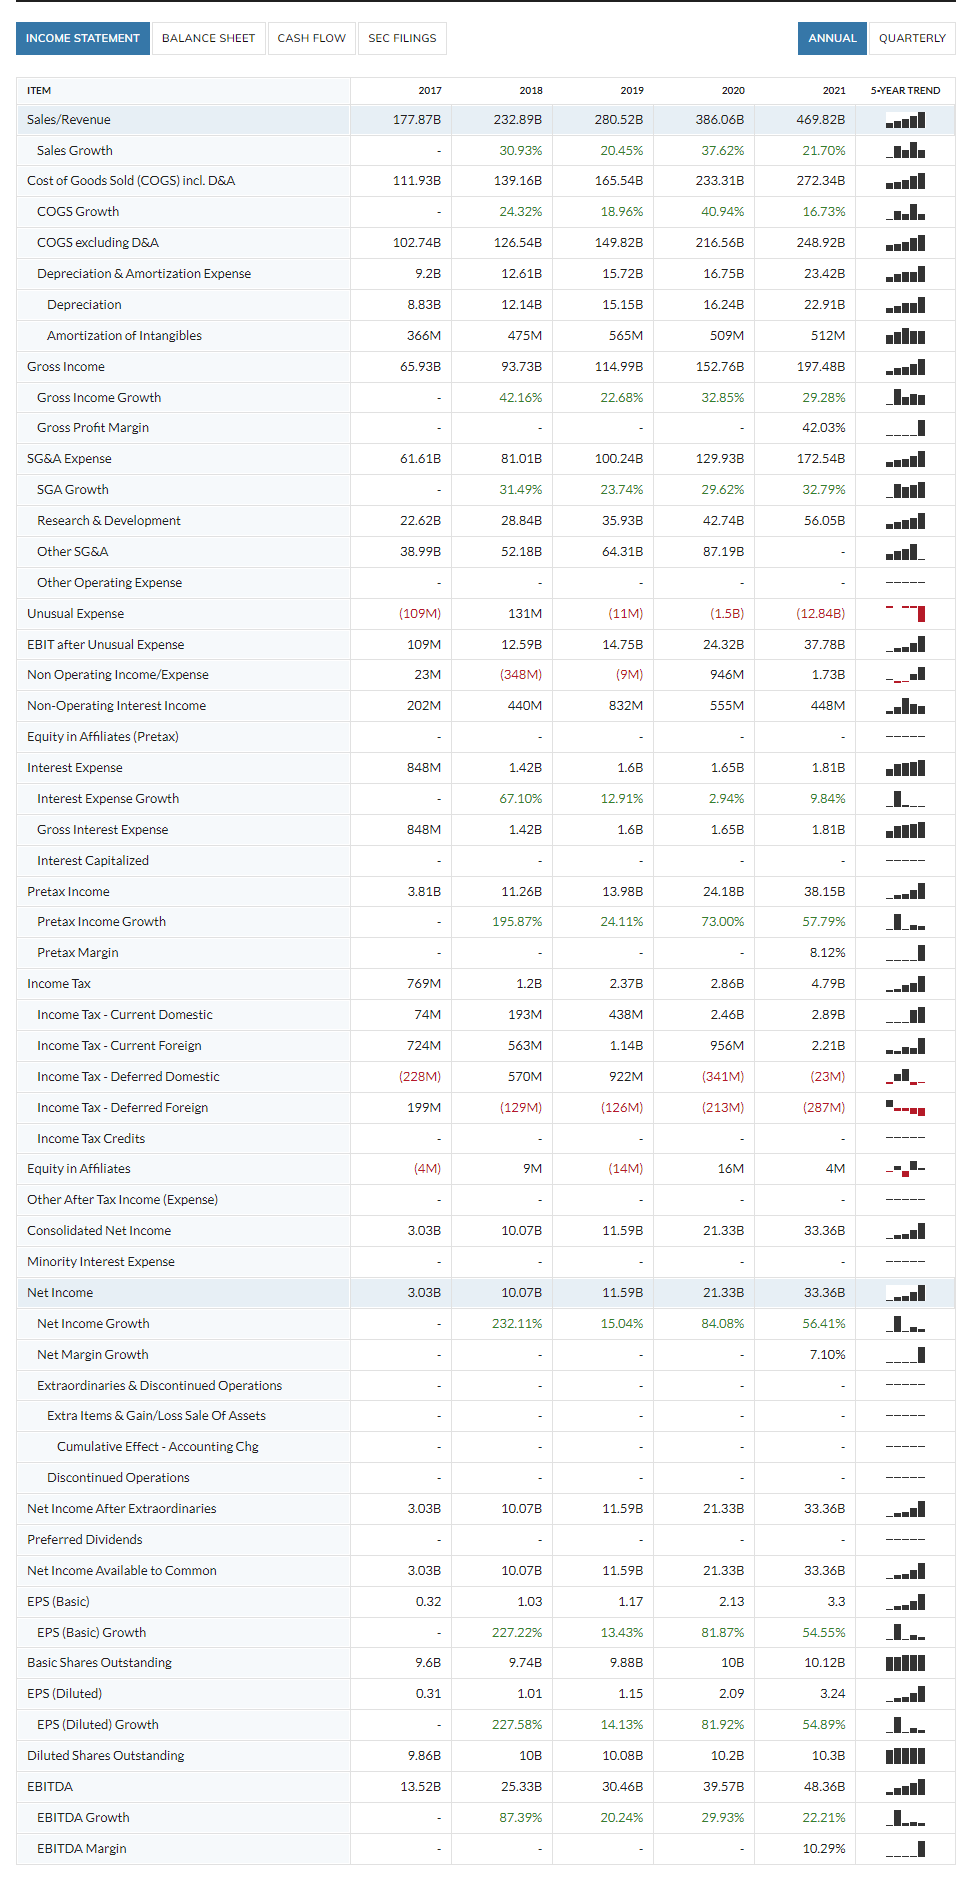
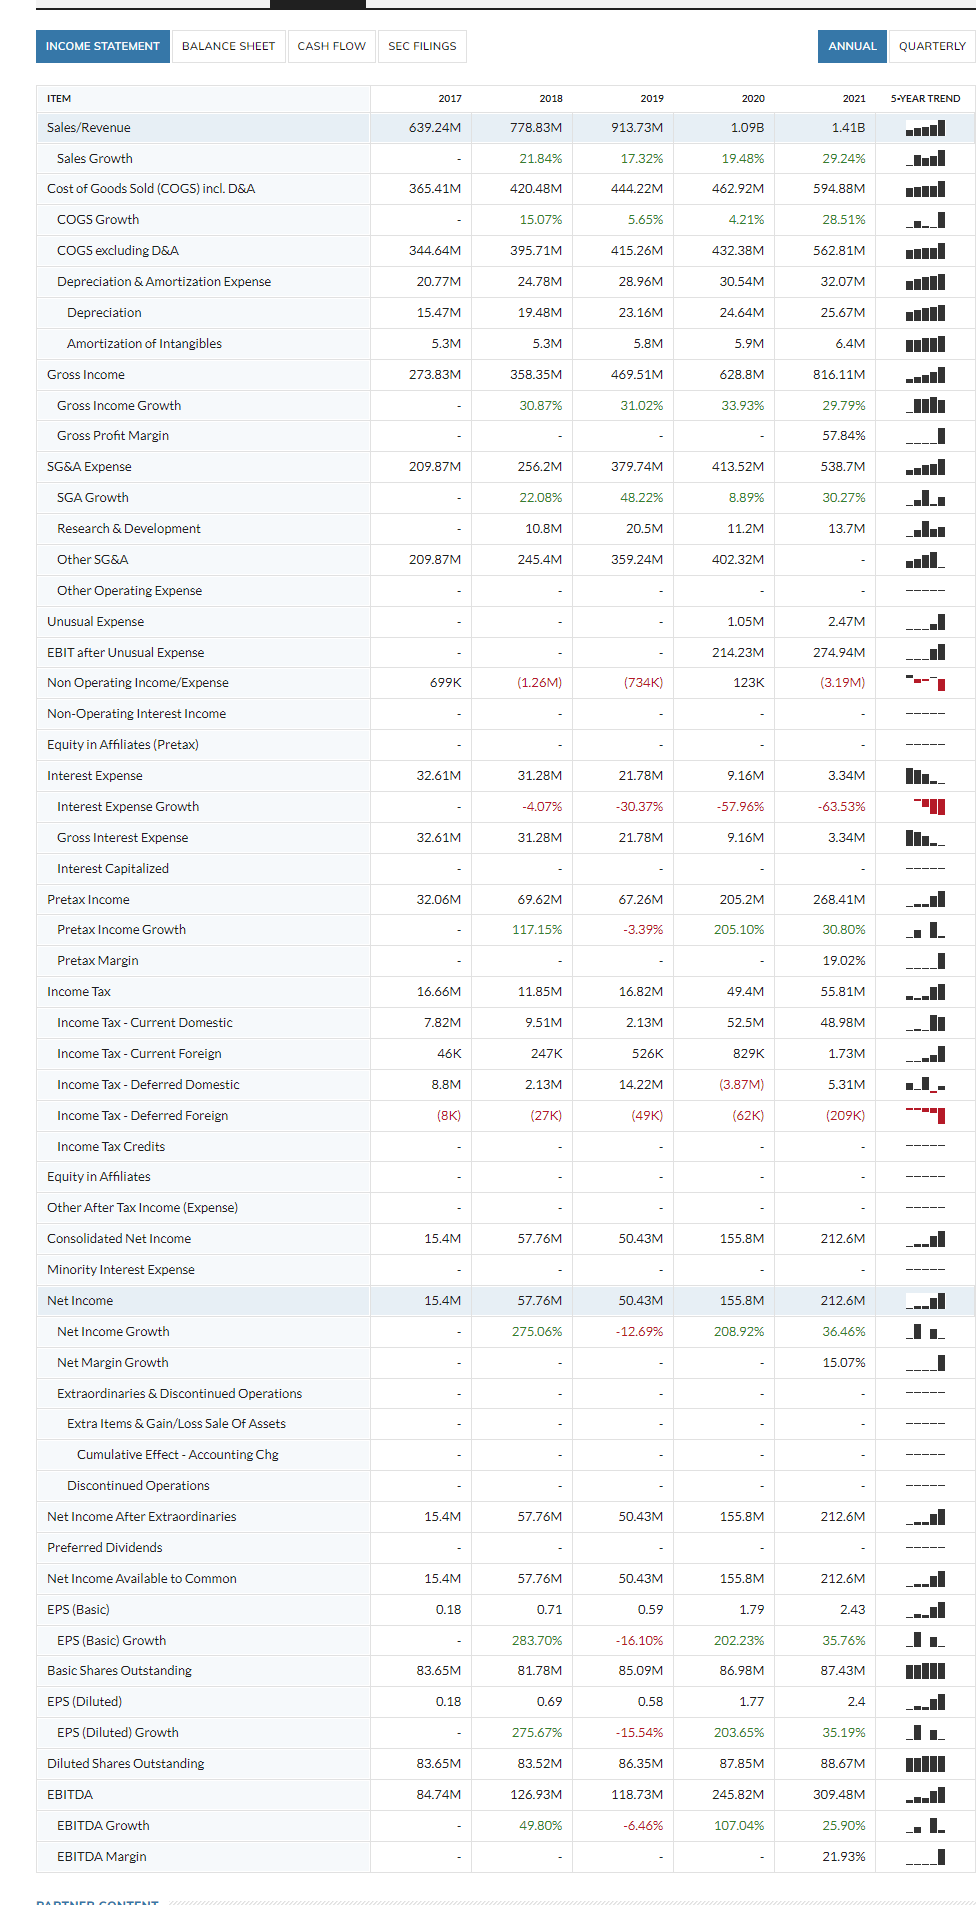
Below are the statements of operations of some companies showing a 5-year trend.
Tesla Income Statement 5-year trend – an example of comparative statement of income
Google Income Statement 5-year trend
Facebook Income Statement
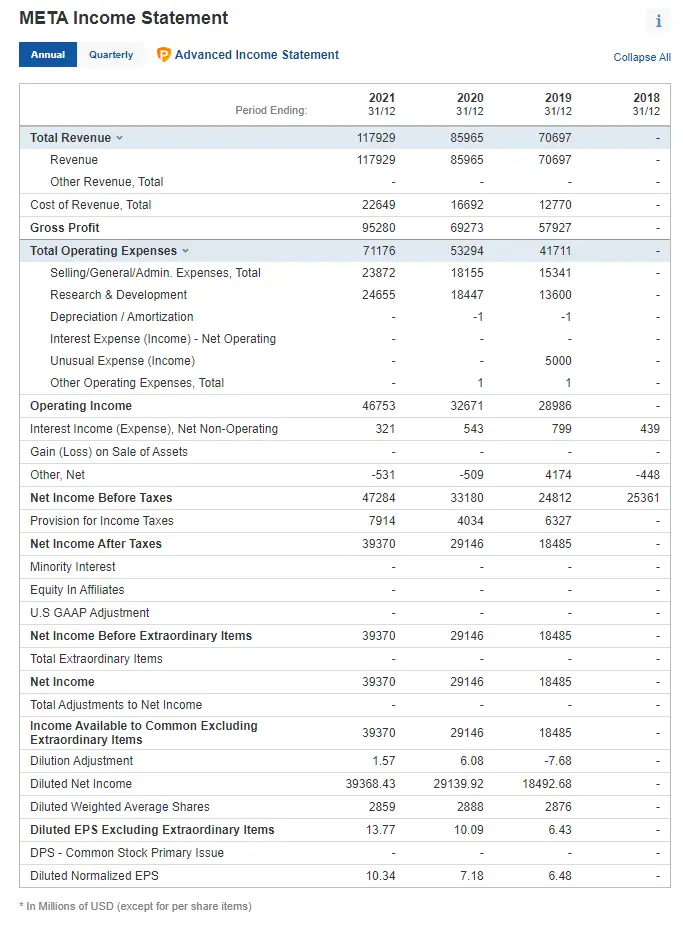
Source: Investing.com
Multi-step income statement
A multi-step income statement is a profit and loss statement that shows how revenue and expenses are related to each other. It starts with gross profit, which is revenue minus the cost of goods sold. From there, it deducts operating expenses to get to operating income. Finally, it subtracts other expenses, such as interest and taxes, to get to the net income.
It is called a “multi-step” income statement because it breaks down the operating activities into different steps. This P&L statement is different from a single-step income statement, which only shows the total revenue and expenses for a period of time. The multi-step income statement is used by businesses to track their financial performance over time and to make decisions about where to allocate their resources.
The multi-step revenue statement provides more information than a single-step statement of operations, as it breaks down income and expenses into different categories. This helps investors and analysts to better understand a company’s financial health. The categories used in a multi-step income statement can vary, but typically include operating expenses, cost of goods sold, and other income or expenses.
Multi step income statement example
Large organizations and companies use multi-step statements. Below are some examples of multiple steps statement of operations of popular companies.
Apple income statement example
Source: WSJ.com
The multi-step income statement shows where their money is coming from and where it’s being spent. It is helpful in identifying areas of improvement and making informed decisions about where to allocate resources.
Projected income statement (Budgeted Income Statement)
A projected income statement is a financial document that shows a company’s expected revenue and expenses for a future period of time by making estimates. It is also known as a Budgeted income statement, Pro Forma Income Statement, or Budget Income Statement. This statement can be used to help make business decisions and track the financial performance of a company over time. The projected orifit and loss statement typically includes the items on the regular statement of operations such as sales, cost of goods sold, operating expenses, and net income.
The purpose of a projected income statement is to estimate your company’s financial performance for the upcoming quarter or year. This includes revenue, expenses, and net income. The goal is to give you an idea of how your business will fare in the future and to make necessary adjustments to ensure that you are on track to meet your financial goals.
A projected income statement can be prepared from past sales and expenses, especially by established businesses. You make use of past sales and expenses to serve as a guide to the future.
How to read a profit and loss statement
There are 2 methods commonly used in reading an income statement: vertical analysis and horizontal analysis.
Vertical Analysis
In the vertical analysis of reading an income statement, the amount of each account is listed as a percentage of gross sales (for revenue accounts) or as a percentage of the operating expense in the case of expenses. This means every item is compared with a single base item. This gives a clearer picture of how they relate to each other.
The challenge or limitation of the vertical analysis in reading a profit and loss statement is that it does not tell the actual trend over the reporting period; for example, rent can be 10% of the operating expense in January and 15% of the operating expense in February.
Just looking at the percentages does not tell you whether the amount of dollars that made the 10% of the rent in January is actually lower or higher than the amount of dollars that makes the 15% of February. Assuming the operating expense is high in January and lower in February, then the 10% of the rent is actually higher in dollar value than the 15% in February.
Hence, the vertical analysis of reading an income statement is good when comparing the line items at a specific point in the reporting period than when comparing two points within the reporting period. That way you can know what item brings in more revenue or what item takes more of the expenses at a specific point in time.
For example, the vertical analysis of reading a profit and loss statement would be more useful when you compare January items alone than when you compare January and February items.
Horizontal Analysis
The horizontal method of reading an income statement uses the dollar amount instead of percentages. This way, the horizontal analysis makes it easier to compare two or more points within the reporting period. You get to know the actual changes in the dollar value of each item, whether it increases or decreases over time. Using the vertical method would not be accurate in this case as a smaller percentage at a point may be higher than a larger percentage at another point when they are converted to their actual dollar amounts.
Components of an income statement
The Revenue, Gains, Expenses, and Losses make up the 4 parts of an income statement. Each of these key features has subdivisions under them.
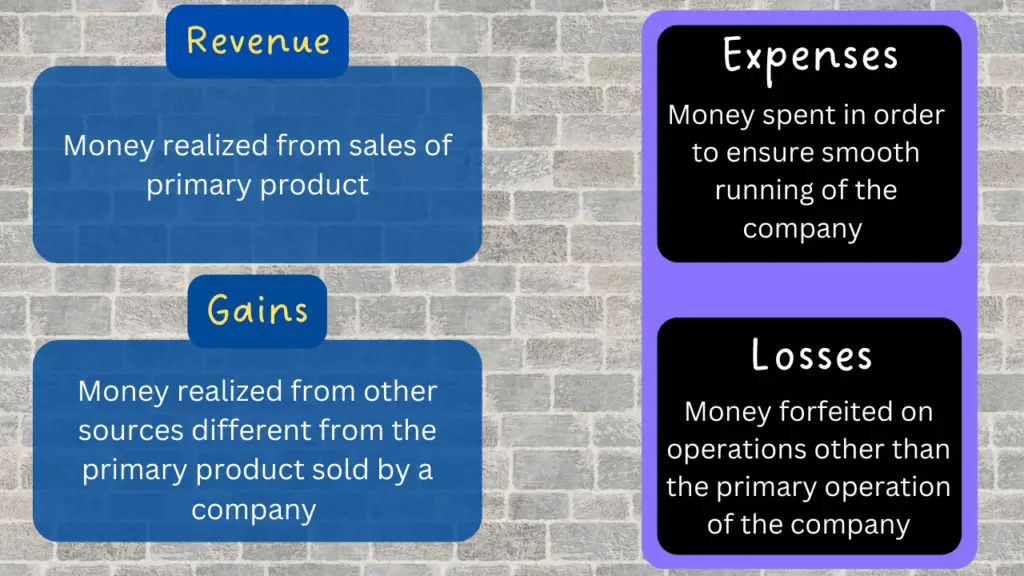
What are the 4 parts of an income statement?
The 4 main parts of an income statement are revenue, gains, expenses, and losses. We will discuss each of these 4 main components of the statement of operations below including the items listed under them.
Operating revenue
The operating revenue on income statement is the money earned from a company’s main products or services. When a company sells cars, the operating revenue would be the money earned from the sales of the cars. For a laundry service company, the money realized from washing and cleaning is the operating revenue.
Non operating revenues and expenses
Non operating revenue is the money earned from other aspects of a company that is not the primary activities of the business. Anything that brings income to a firm other than the main product or service for which the business was created, would be regarded as non operating revenue.
These activities outside of the main essence of the business are regarded as secondary. Non-operating revenue is the money realized from the secondary activities of a business.
Examples of non operating revenue on income statement
- Interest realized from a company’s savings account in the bank
- Money earned from patents, franchises, royalties, etc.
- Earnings from investments such as stocks in another company that has appreciated in value
- Income realized from an advertisement on a company’s property or asset such as a school being paid to place banners on their staff bus. In this case, the school’s primary activity is tuition and the operating revenue is the money realized from school fees; placing banners on the school fence, bus, or any other place and paying the school would therefore be a secondary income outside of the primary goal of the school and would be regarded as a non-operating revenue.
- If a business has additional offices and rents them out, then revenue realized from this would be regarded as non-operating revenue.
What is not shown in the income statement?
An income statement would not include assets, liabilities, equity, dividends, unrealized investments, and any other account that does not generate revenue or incur an expense.
To be included on the statement of financial performance, an account should be able to make an income or incur an expense; or it should generate gains or cause losses to a company.
Generally, an income statement would not include an account that does not generate revenue or incur losses.
List of Income Statement Accounts and other line items
- Revenue
- Expenses
- Selling, General and Admin Expenses (SGA)
- Costs of goods sold (COGS)
- Gross profit
- Operating income
- Income before taxes
- Net income
- Earnings per share (EPS)
- Depreciation
- EBITDA
The names of the income statement accounts depend on the type of firm, the industry practices, and the laws and regulations of the country or state in which the firm is located.
Some of the income statement accounts may have subdivisions (depending on the company); for example, expenses may have salaries and wages, procurement, rent, etc.
Revenue
Income statement revenue is the amount of money a company made from sales during the period of reporting; hence, it is also known as sales revenue.
Revenue and expenses on the income statement are classified as operating when it is related to the primary business operations. For example, revenue from the sale of a product, rendering of a service, or any income that is gotten from the main operation of the business would be regarded as operating revenue.
Revenue and expenses on the profit and loss account are classified as non-operating when they are from other sources other than the primary business operations. Examples of non-operating revenue may include income from rental, revenue from patents, or income from goodwill.
For example, if the major operation of a business is rentals of houses and buildings (in the case of a real estate company), then the revenue from rent would be regarded as operating revenue and not as non-operating revenue.
Revenue and expenses on the income statement are classified as non-operating also, when they are from unusual or infrequent sources such as gains from the sale of stocks or income made from the sale of fixed assets that need to be disposed of, such as land.
Return inwards in income statement
Returns inwards refer to the goods returned by customers to the company. This could be because of damage, expired products, etc.
Return inwards in income statement are subtracted from revenue or sales.
Revenue vs Receipts Differences
Revenue in income statement differs from receipts in the way they are accounted for; revenue is reported when a product is sold or service is rendered (whether it was sold on credit or not). Receipts do not get recorded until the money is received.
For example, a customer buys 100 packs of protein bars on credit totaling $500 in August; this would be recorded as revenue on the income statement for the month of August. When the customer pays the money later, it would be regarded as a receipt of $500 and would be recorded on the balance sheet as an increase in cash of $500 and a reduction of the account receivable by $500.
Is deferred revenue on income statement?
Deferred revenue is an unearned revenue that is not yet received, hence it cannot be added to the profit and loss account.
Gains and Losses on Income Statement
The gain on an income statement represents the money made by a business from unusual sources or irregular sources other than the main business activity. For example, a gain can be made by selling an old property such as a building, car, etc. A gain could also be an increase in the value of an asset or property.
For example, if Anael Shoes Inc. owns stocks in another company worth $1 million dollars; when the stocks increase in value to $2 million dollars, the gains on the income statement of Anael Shoes Inc. would be recorded as $1 million dollars (2 million -1 million).
Discontinued Operations
On an income statement the discontinued operations appear as a separate line item and represents the selling or termination of a part of a company’s operations. A company may decide to terminate one aspect of its operations for many reasons, the common reason being lack of profit or redundancy.
Whenever a company plans to sell part of its operations in the future, that aspect of the company is said to be held-for-sale. This is not a part of the ongoing business, hence, any gain from discontinued operations cannot be reported as part of the operating revenue.
Expenses in income statements
Expenses in the income statement are the costs associated with running the company in order to make a profit; this can include the money used for paying salaries, the money needed to manufacture the products sold by the company, or money needed to render services (for a service-based company), as well as money used for research and development of better products.
There are two types of expenses on income statements: operating expenses and non-operating expenses.
Operating expense
The operating expense is the cost incurred in order to carry out the main business activity.
Carriage outwards in income statement
The carriage outwards in income statement is the cost incurred by a company in transporting goods to the customer.
The cost of carriage outwards in a profit and loss statement is reported as an operating expense.
Carriage inwards in income statement
The carriage inwards is the cost incurred by a company to transport materials from the supplier to the company. It is therefore an expense that can appear as the cost of material consumed.
How is bad debt expense reported on the income statement?
Bad debt expense is reported on the income statement as part of the selling, general & administrative costs within the operating expense section.
Non-operating Expense
The non-operating expense is the cost incurred in order to carry out the secondary business activities.
Research and development expense (R&D)
R&D expense on the statement of financial performance appears as a separate line item under the operating expense section. It is the money used for research and development during the reporting period.
Cost of goods sold on an income statement
The cost of goods sold in the income statement is the amount of money it takes to produce the product being sold by a company. The COGS includes the cost of purchasing materials for production, the cost of hiring direct labor, and any overhead costs needed for the production of the goods. The cost of goods sold does not include the cost of advertisement because advertisement is not used for production.
The cost of goods sold (COGS), therefore, is the direct cost incurred before a product is produced and sold. For a service-based business, the COGS is known as the Cost of Sales. Examples of the cost of goods sold include the cost of direct labor, the cost of buying materials, etc.
Depreciation
Depreciation records the loss in value of an asset over time. It is important because of the benefits that companies get by including depreciation in their financial statements. The depreciation value is factored mainly for tax deductions which in turn reduces the taxable income that would have been charged.
Depreciation on an income statement may not appear directly as an item but is added to the cost of goods sold or to the selling, general and admin expenses. However, some companies may decide to list depreciation and amortization as separate items on their statement of earnings.
Therefore, depreciation on an income statement can be recorded as the cost of purchasing equipment (and this appears under the Cost of goods sold), it can be added to the SG&A expenses, or it may be listed separately as a line item in an operating statement. When listed differently, the depreciation has to be calculated using any method of calculating depreciation (the straight-line method or accelerated method).
Example of depreciation expense on income statement
Assuming Anael Farms bought a combine harvester for $20,000. To report the depreciation expense on income statement, the accountant would calculate the depreciation as follows:
- Estimate the life span of the combine harvester = let’s say 10 years.
- Estimate the salvage value = let’s say $2,000
Using the straight-line depreciation formula: (asset cost– salvage value)/useful life
The yearly depreciation expense would be: (20,000 – 2,000)/10 = $1,800
This means that every year, $1,800 would be recorded as depreciation expense on the profit and loss statement of Anael Farms for the next 10 years.
If the income statement is prepared monthly, then the monthly depreciation expense would be: (20,000 – 2,000)/(12 x 10) = $150
This means that every month, $150 would be recorded as depreciation expense on the profit and loss statement of Anael Farms for the next 10 years.
Gross profit
The gross profit in the income statement is the amount of money that remains after the cost of sales has been deducted from the total revenue. It can be calculated as total revenue minus COGS.
Gross profit = (Total revenue – Cost of goods sold)
For example, if a tech company sold 100 laptops at $200 each, and the cost of producing 1 laptop is $121; then the gross profit can be calculated as:
Total revenue = 200 X 100 = $20,000
Cost of goods sold = 121 X 100 = $12,100
In the statement of financial performance, the gross profit would be reported as 20,000 – 12,100 = $7,900
Selling, General and Administrative expenses
SGA expense on income statement is the cost incurred to carry out the secondary business activity such as payment of salaries and wages, transportation expenses, utilities expense, maintenance and repairs, rent expenses, office supplies, etc.
EBIT on income statement (Earnings Before Taxes)
Earnings Before Taxes (EBT) or Income before taxes would be reported on the income statement as the income realized after deducting the expenses from the revenue. EBT is usually calculated before deducting the income tax from it.
Interest expense in income statement
Interest expense would be reported on the income statement as the total amount of money that has been spent on repaying loans or debt during the reporting period.
For example, if a company pays $1000 monthly interest on repaying its debt, it means $3,000 would be reported as interest expense on the income statement of the 1st quarter (from January to March).
Income tax expense
The income tax expense on income statement is simply the money paid as tax to the government. Companies pay taxes differently, this means that one company may have a higher tax rate than another. Because of this, the earnings before tax are used to compare companies to see which is more profitable, because when the tax is deducted, the earnings may not show the true earnings realized by each company.
Comparing companies’ earnings before deducting taxes would ensure fairness in order to determine their profitability.
Net income on income statement
This is also called net profit, net sales, or net earnings. The net income on the income statement is the amount of money that remains after all taxes and expenses have been deducted from the revenue. It represents the amount that is free to be used when the taxes have been paid and all the expenses have been deducted.
The net income is on what financial statement?
The net income appears directly on the income statement as the last line; hence it is also called the bottom line. The net income is the money that is available to the shareholders or the owner of a sole proprietorship.
The net income formula can be expressed as:
Net Income = (Total Revenue + Gains) – (Total Expenses + Losses + Income Tax)
EBITDA: Earnings before interest, depreciation, taxes, and amortization
EBITDA is the Earnings before interest, depreciation, taxes, and amortization. It represents
The EBITDA on an income statement is calculated by finding the difference between the gross profit and the selling, general and administrative expenses (SGA).
Which accounts are found on an income statement?
The income statement would include the following accounts: Revenue, Expenses
Selling, General and Admin Expenses (SGA), Costs of goods sold (COGS), Gross profit, Operating income, Income before taxes, Net income, Earnings per share (EPS), and Depreciation
Key income statement ratios
- Earnings per share (EPS)
- Gross Profit Margin
- Net Profit Margin
- Assets Turnover
- Return on Assets
- Price-Earnings Ratio
- Operating Profit Margin
- Interest Coverage Ratio
- Return on Equity
Earnings per share
The earnings per share (EPS) is a financial measure that calculates the profit for each share of a company’s stock. This metric is used to determine how much profit a company generates for each unit of its stock. The earnings per share is calculated by dividing the net income by the number of shares outstanding.
EPS formula = (Net Profit – Preferred Dividends) / Outstanding shares of common stock
The higher the EPS, the more profitable a company is considered to be.
Gross Profit Margin
The gross profit margin is an income statement ratio that measures the profitability of a company. Gross profit margin shows the percentage of revenue that remains after deducting the cost of goods sold. It is calculated by subtracting the cost of goods sold from the revenue, and then dividing by the revenue. The higher the gross profit margin, the more profitable the company is.
Gross Profit Margin formula = (Revenues – COGS) / Revenues
A high gross profit margin indicates that a company is able to generate a lot of revenue with relatively little expenditure.
Net Profit Margin
The net profit margin is one of the income statement ratios that measures the percentage of profit a company generates after accounting for all expenses. A company’s net profit margin can be calculated by dividing its net income by its total revenue.
Net Profit Income formula = Net Profit / Total Revenue
Net profit margin is a good indicator of a company’s financial health and profitability. A high net profit margin indicates that a company is efficient in generating profit and is able to cover all of its expenses.
Assets Turnover
Assets turnover is a key financial metric that measures how efficiently a company is using its assets to generate revenue. A high assets turnover ratio indicates that a company is generating a lot of sales from its assets, while a low ratio indicates that the company could be using its assets more effectively.
There are a few different ways to calculate assets turnover, but the most common formula is to divide a company’s sales by its total assets. This number can then be compared to industry averages to see how the company stacks up.
To calculate a company’s asset turnover ratio, you simply divide its sales by its total assets.
Assets Turnover formula = Sales / Total Assets
Assets turnover is an important metric for investors to watch because it can give insights into a company’s efficiency and profitability. If a company has a low assets turnover ratio, it may be time to take a closer look at how it’s using its resources. A company with a high assets turnover is usually more profitable than a company with a low assets turnover.
Return on Assets
The return on assets (ROA) is an income statement ratio that tells you how much profit a company makes in relation to its total assets. This is a key metric for judging a company’s financial strength and profitability. To calculate ROA, you divide the company’s net income by its total assets.
The ROA formula is ROA = Net Income / Total Assets
A high ROA means that the company is generating a lot of profits from its assets, while a low ROA indicates that the company could be doing better.
Price-Earnings Ratio
The price-earnings ratio (P/E) is a key financial metric that investors use to assess a company’s stock price. It measures the relationship between a company’s share price and its earnings per share (EPS). P/E ratio is a measure of how expensive a stock is. It is calculated by dividing the price of the stock by the earnings per share.
P/E ratio formula = Stock / Earnings per Share
A high P/E ratio means that investors are willing to pay more for a company’s shares, relative to its earnings. This may be due to expectations of future growth or simply because the company’s shares are in high demand. However, a high P/E ratio can also be a sign that a stock is overvalued, so it’s important to do your research before making any investment decisions.
Operating Profit Margin (EBIT Margin)
The operating profit margin is also known as Return on Sales (ROS) or Earnings Before Interest and Tax Margin (EBIT Margin) is the percentage of profit a company makes from its operations before deducting taxes and interest charges.
Operating Profit Margin formula = Operating Profit / Total Revenue. It is usually expressed as a percentage.
A high operating profit margin indicates that a company is efficient and has good control over its costs. Conversely, a low operating profit margin indicates that a company needs to improve its efficiency and/or reduce its operating expenses.
Interest Coverage Ratio
The interest coverage ratio is also known as the Times interest earned is a financial measure that shows how well a company can pay its interest expenses. This ratio is determined by dividing a company’s earnings before interest and taxes (EBIT) by its total interest expenses.
Interest Coverage Ratio = Earnings before Interest and Tax / Interest Expenses
A high interest coverage ratio indicates that a company can easily pay its interest expenses, while a low ratio suggests that a company may have difficulty meeting its obligations.
Return on Equity
Return on equity (ROE) is a financial ratio that measures the profitability of a company in relation to the amount of equity capital it has. ROE is calculated by dividing a company’s net income by its shareholder equity.
ROE = Net Income / Shareholder’s Equity
It is used for comparing the performances of companies in the same industry. A company with a higher ROE is more profitable and efficient than one with a lower ROE.
Creating an income statement
Just as the accounts on a balance sheet are arranged in an orderly manner (starting with the most liquid to the least liquid account), the order of income statement accounts starts with Revenue as the top line and ends with Net Income as the bottom line. Some financial ratios are also calculated as you move down the income statement. We will show you how the order of income statement accounts is reported and also how the values and some ratios are determined.
Are income statements monthly or yearly?
Income statements are often prepared as quarterly and annual reports, showing the income and expenditure over a period. For example, it can show the yearly income and expenditure for 5 years or may be prepared to show the monthly income and expenditure every quarter.
Preparing income statement
An income statement lists a company’s revenues and expenses during a specific period of time, typically one year. The operating statement can either be prepared using the accrual method or the cash method. The accrual method records revenues when they are earned and expenses when they are incurred, regardless of when the cash is actually received or paid. The cash method records revenues when cash is received and expenses when cash is paid out. Most companies use the accrual method because it provides a more accurate portrayal of a company’s financial activity.
Preparing income statements can be carried out manually or using accounting software. The popular accounting software companies that you can use to prepare an income statement or other financial statements include:
- FreshBooks
- QuickBooks
- Zoho Books
- Xero
- Sage Intacct
The income and expenditure account is prepared by using trial balances from any two points in time. The names of the accounts or line items used in preparing income statements vary based on industry, jurisdiction, and type of accounting standard used. But generally, every statement of income can be divided into sections, which are described below.
Heading
The profit and loss account starts with a heading. The income statement heading will specify the name of the company at the top and then just below it is the name of the financial statement and also the reporting period. The income statement heading will specify the currency and the units of the figures presented in the statement; for example, a statement of income may state that the values are in millions of dollars or thousands of dollars.
The First Section (Top Line)
The first section of a profit and loss statement is typically dedicated to income. This will include all of the revenue that your business has earned during the specified time period. It’s important to break down income by source so that you can see which areas are generating the most revenue.
The income section of a profit and loss statement will show you how much money your business earned during the period of time covered by the statement. This will usually be shown as gross income, which is the total amount of money earned before any expenses are deducted.
Second Section
The second section of a profit and loss statement is dedicated to expenses. This is where you’ll list all of the money that your business has spent during the specified time period. Again, it’s important to break down expenses by category so that you can see where your money is going.
The expenses that are deducted from gross income include things like the cost of goods sold, operating expenses, and taxes.
Last Part (Bottom line)
The final section of a profit and loss statement is the bottom line, which is simply the difference between income and expenses.
The net income, which is what is left after all expenses are deducted, is what is used to determine whether a business made a profit or suffered a loss.
If your business has more income than expenses, it’s in profit; if it has more expenses than income, it’s in loss.
Contents of an income statement
Though the contents of an income statement vary depending on the company and its activities; there are some key line items that are expected to be in most operating statement.
There are several key items that must be included in a profit and loss statement. The first is gross profit, which is the total revenue minus the cost of goods sold. This figure provides a snapshot of the company’s overall profitability.
Another key item on the income statement is operating expenses, which include things like selling, general, and administrative expenses. This figure provides insight into how much it costs the company to run its day-to-day operations.
Finally, net income is the bottom line figure, which represents the company’s total profitability after all expenses have been accounted for.
How to calculate income statement items
In a multi step income statement, the net income is not directly calculated by simply subtracting expenses from revenue as is done in a single-step income statement. Some values have to be calculated and use for the calculation of the net income. These are shown below.
How to calculate sales in profit and loss statement
Net Sales = (Total Revenue + Gains) – (Total Expenses + Losses + Income Tax)
How to calculate cost of goods sold from income statement
COGS = (Beginning Inventory + Additional Purchases) – Ending Inventory
The COGS can be used to calculate inventory turnover (which is a measure of the number of times a business sells and replaces its inventory). The COGS is also used to determine the gross margin.
How to calculate gross profit
Gross profit is calculated by finding the difference between the Cost of Goods Sold and the Sales Revenue.
Gross profit = Sales revenue – Cost of goods sold
How to calculate interest expense on profit and loss statement
Interest Expense = Total Debt X Interest Rate
For example, a firm borrowed a loan of 34,000 USD at a 6% interest rate per annum. Its interest expense would be 34000 x (6/100) = $2040.
Income Statement Formula
The income statement formula outlines 3 key values that can be derived from the statement of operations. These three values determined by the income statement formula include gross profit, operating income, and net income.
The use of the income statement formula is simply to determine the net income, hence it can be referred to as the net income formula.
Let’s see how to calculate the gross profit, operating income, and net income using the income statement formulas.
For single-step operating statement:
Net Income = Revenues – Expenses
or
Net Sales = Revenues – Expenses
Income statement formula for multi step statement of operations
For a multi-step operating statement, the gross profit is first calculated and then used to find the operating income; then the operating income is used to find the net income.
Thus, the income statement formula to determine the net income will flow as follows:
Find the GROSS PROFIT —-> then use it to find the OPERATING INCOME —> then use it to find the NET INCOME
To find the gross profit, the formula is Gross Profit = Revenue – Cost of Goods Sales (COGS).
To find the Operating income, the formula is Operating Income = Gross Profit – Operating Expenses
To find the Non-operating items, the formula is Non-operating items = Non-operating income – Non-operating expense.
Finally, the NET INCOME for multi-step P&L statement would be calculated as Net Income = Operating income + Non-operating items
Examples of Income Statements of Popular Companies
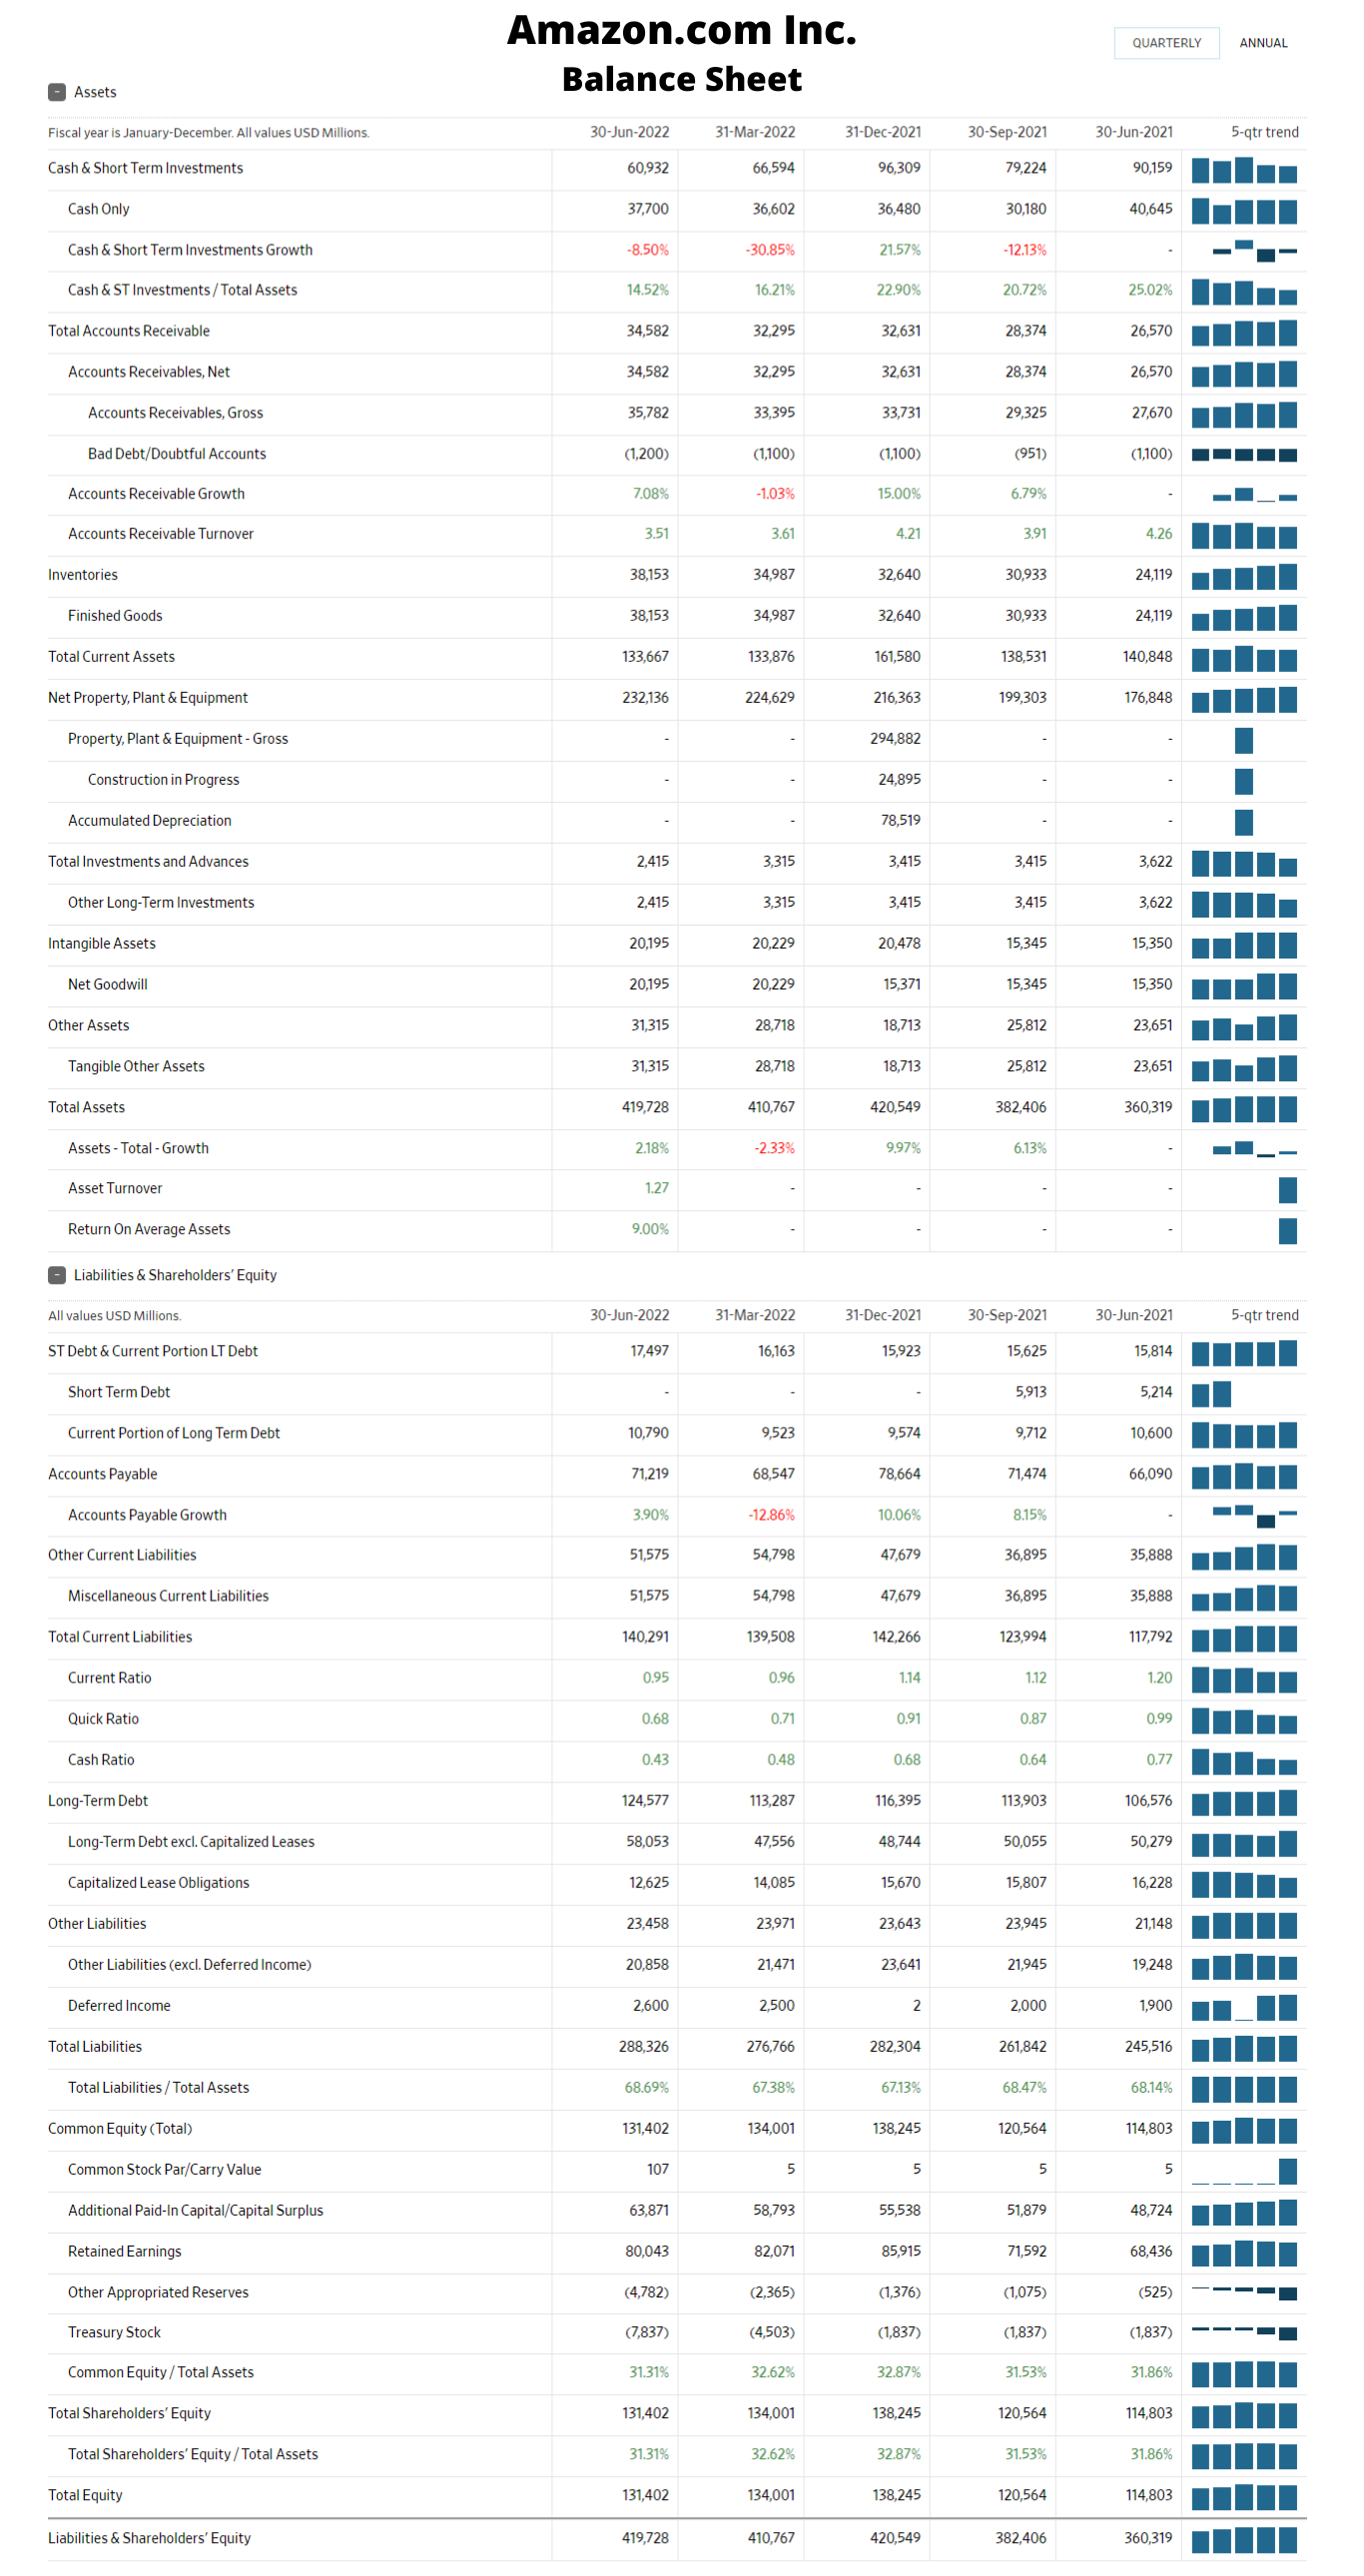
Amazon income statement example
Nike income statement
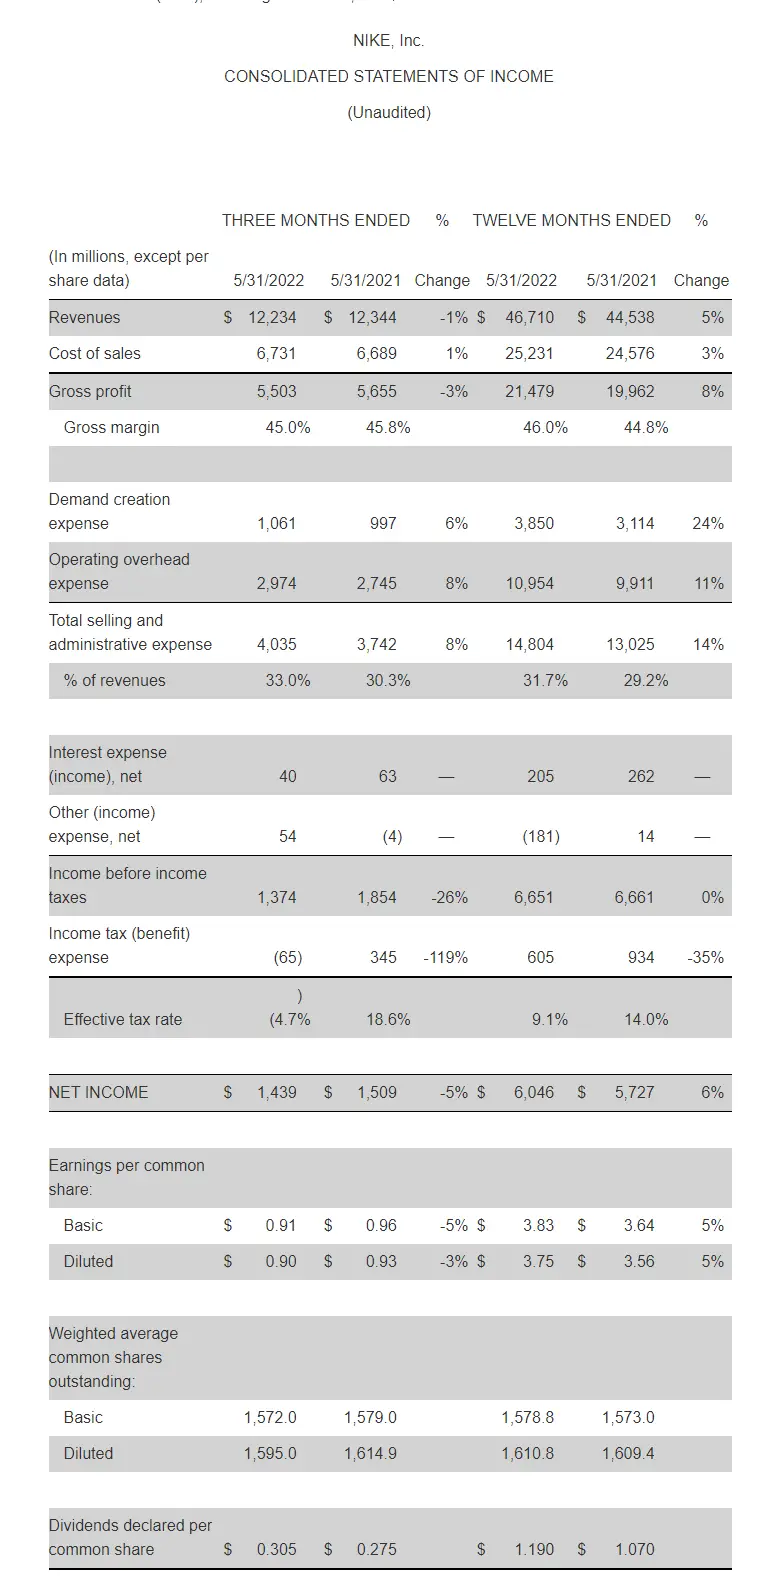
Source: Nike
Netflix income statement format
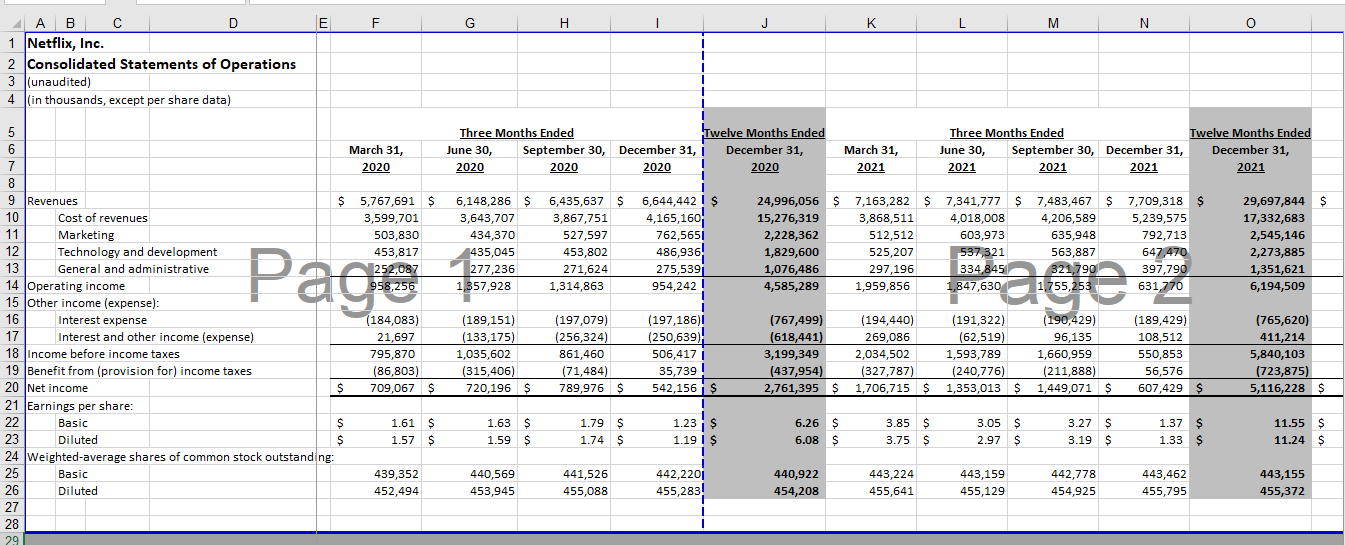
Source: Netflix
Starbucks income statement
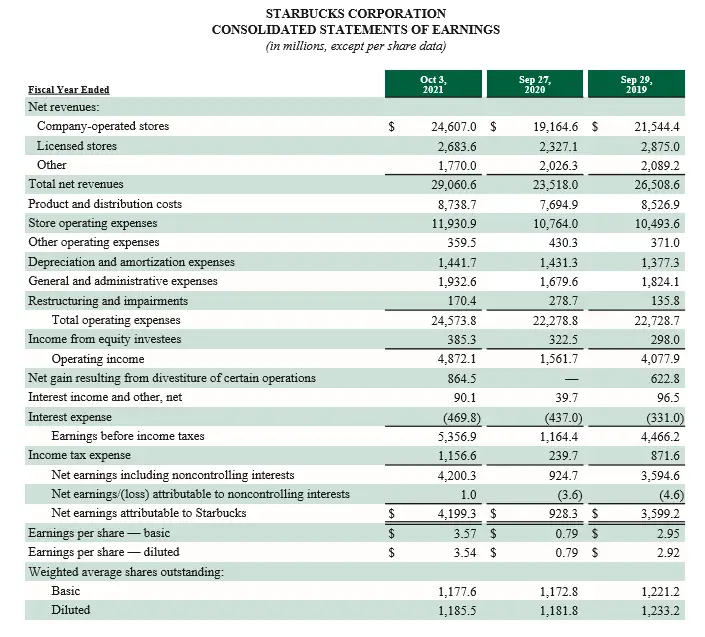
Source: Starbucks
Where to get income statement
You can get the income statements of companies, together with other financial statements from their websites, mostly in the INVESTORS pages or Menus. Most companies bundle their financial statements in a pdf format and upload them to the website. You won’t find the operating statement file separate from the balance sheet or statement of cash flow. They are all included on a page-by-page basis in a single pdf file or other file types.
For example, the financial statements of Apple containing the statement of operations, balance sheet, and statement of cash flow can be found here: https://www.apple.com/newsroom/pdfs/FY21_Q2_Consolidated_Financial_Statements.pdf
You can also get income statements and other financial statements from most financial websites such as NASDAQ, WSJ, Yahoo Finance, etc. For example, the income statement examples shown in the pictures in this article were sourced from WSJ.com, NASDAQ, and Marketwatch.com.
Another good source of finding companies’ income statements and financial statements is the SEC website. For example, Amazon.com Inc.’s financial statement for the fiscal year ended Dec 31 can be found here: SEC Archives
The importance of income statement
- From the profit and loss statement, an investor can know if a company is profitable or not. A company with a positive net income that is increasing when analyzed horizontally means it can be predicted to be more profitable in the future.
- The profit and loss accounts of two or more companies can be compared to give an insight to an investor on the company that is best to invest in. From the sources of revenue and expenses, an investor could know what makes a firm profitable.
- The management of a company can make decisions or change policies based on the information in its statement of operations. For example, if a property or an asset is found to increase expenses without a corresponding increase in revenue, the management could make a decision to rather sell such property or asset rather than keep it.
- You can use the statement of financial performance of your competitors to gain insight into what is working for them. If you find out they spend on new products and it is increasing their revenue, you could try out changing your products as well. If you find out they change the products and lose, you can simply avoid taking a similar step.
Limitations
- Some income statement accounts depend on the estimate of the accountant, which may be exploited to gain tax benefits; that is, there could be an intentional misrepresentation.
- Certain types of revenue and expenses cannot be reported on an income statement, hence, not a true reflection of the total income and expenses.
Income Statement vs Balance Sheet
There are two main financial statements that businesses use to track their finances: the income statement and the balance sheet. The income statement shows a company’s revenues and expenses over a specific period of time, while the balance sheet shows a company’s assets, liabilities, and equity at a specific point in time.
Differentiating income statement from balance sheet
So, what’s the difference between the two? The income statement measures a company’s financial performance over time, while the balance sheet provides a snapshot of a company’s financial position at a particular point in time. Both the income statement and balance sheet are important tools for business owners and investors alike. By understanding how these two financial statements work, you can get a better grasp of a company’s overall financial health.
Balance sheet and Income Statement Differences
- The financial statement that reports revenues and expenses is the income statement while the financial statement that reports assets, liabilities, and equity is the balance sheet.
- Unearned revenue in the balance sheet refers to the revenue that is not yet received; when earned, it becomes operating revenue in the income statement.
- In the balance sheet, revenue is not reported as an account whereas in the income statement revenue can be reported as operating and non-operating.
Income statement and balance sheet examples
Balance Sheet Example
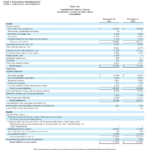
Yeti Income Statement Example
Source: Marketwatch.com
Balance sheet and Income Statement Similarities
How do income statement and balance sheet connect?
The link between an income statement and a balance sheet is that both are financial statements that show the financial health of a company. The two statements are interconnected because the net income from the income statement becomes part of the equity on the balance sheet.
Table showing the difference between Balance sheet and Income statement
| Criteria for comparing a balance sheet and income statement | BALANCE SHEET | INCOME STATEMENT |
|---|---|---|
| Other names | Also known as a statement of financial position. | This financial statement summarizes company revenue and expenses; other terms are profit and loss account, statement of operations, or statement of financial performance. |
| Accounts | Assets, liabilities, and equity | Revenue, Expenses, Gains, and Losses |
| Structure | A balance sheet has 2 columns for Assets on the left and Liabilities and Equity on the right. | An earnings statement starts with REVENUE, known as the top line, and ends with NET INCOME, known as the bottom line. |
| Period covered by the financial statement | It gives the financial report of a company at a point in time | It gives the financial report of a company over a period of time |
| Function | It is useful for analyzing the liquid assets that a company has that can cover its financial obligations such as paying dividends or loan repayment. | It is useful in analyzing the amount generated by a company and associated expenses in order to know if the company is profitable or not. |
| Types | Personal balance sheet and consolidated balance sheet | Single-step and multi-step income statement. |
Income Statement vs Cash flow Statement
A financial statement that summarizes company revenue and expenses is known as the statement of revenue and expenses whereas a financial statement that gives details of the cash inflows and outflows is known as the statement of cash flow.
An earnings statement focuses on a company’s profitability, recording all revenues and expenses over a set period of time. A cash flow statement, on the other hand, tracks the inflow and outflow of cash and equivalences over a period of time. This means that the cash flow statement will include things like investments and loans, whereas the earnings statement will not. While an income statement can be prepared for any time frame, a cash flow statement must be prepared at least quarterly.
From a cash flow statement, you can know how much cash a company has on hand and how this cash has been generated. This statement can be used to calculate the company’s operating cash flow.
Trial Balance Vs Income Statement
A trial balance is a statement of all the ledger account balances at a specific point in time. This includes both debit and credit balances. On the other hand, an income statement is a financial statement that reports revenues and expenses over a period of time; it also shows the net income or loss for the period.
The main difference between a trial balance and an income statement is that a trial balance lists all of the account balances at a certain point in time, while an earnings statement lists only the account balances that have changed during a specified period of time. For example, if you were to look at a trial balance on December 31, 2020, it would show the balances of all accounts on that date. If you were to look at an earnings statement for the year 2020, it would show the balances of all accounts that had activity during that year.
Another difference between a Trial Balance and an Income Statement is that a Trial Balance includes all of the account balances in a company, while an Income Statement only includes the accounts that generate revenue.
The Trial Balance is used to prepare financial statements like the Balance Sheet, while the Income Statement can be used to make decisions about where to allocate resources. The trial balance is useful to spot errors in a company’s accounting, hence, it is used for things like balance sheet substantiation.
Statement of Retained Earnings vs Income Statement Differences and Similarities
The financial statement that reports revenues and expenses is called the Profit and Loss statement (P&L) or the income statement. Whereas the retained earnings statements show how much of net income or profit is being reinvested back into a company.
The Statement of Retained Earnings also takes into account any dividends that have been paid out to shareholders, while the Income Statement does not.
Statement of Retained Earnings and the Income Statement both provide financial information about a company. The Statement of Retained Earnings shows how much profit a company has made and how much of that profit has been reinvested back into the company. The Income Statement shows a company’s revenue, expenses, and net income. Both statements can be used to assess a company’s financial health and performance.
Last Updated on November 2, 2023 by Nansel Nanzip Bongdap
Nansel is a serial entrepreneur and financial expert with 7+ years as a business analyst. He has a liking for marketing which he regards as an important part of business success.
He lives in Plateau State, Nigeria with his wife, Joyce, and daughter, Anael.