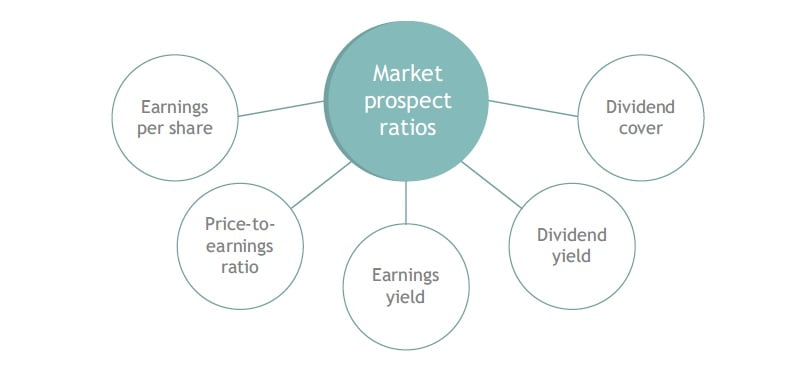
Market prospect ratios are also known as market value ratios. They are key tools that investors use to assess the potential return of an investment. The most common market prospect ratio is the price-to-earnings (P/E) ratio, which measures the relationship between a company’s stock price and its earnings per share. There are many market value ratios; each has its advantages and disadvantages. We will define each type of market value ratio, its formula, examples, and limitations.
Investors typically use market prospect ratios to compare companies within the same industry or sector. This allows them to identify companies that may be undervalued or overvalued relative to their peers.
There are a number of other important market prospect ratios that investors should be aware of, including the price-to-book (P/B) ratio, the price-to-sales (P/S) ratio, and the enterprise value-to-EBITDA (EV/EBITDA) ratio.
What are market prospect ratios?
A market prospect ratio is a tool used by investors to help assess the potential return of an investment. There are different market prospect ratios and each has its benefits and limitation. Investors typically use market ratio analysis to compare different investments and make decisions about which ones to buy or sell.
You can take a look at the ranges or averages of market prospect ratios by industry, state, etc. This gives a general overview of what is expected in a given industry so as to compare it with the stock or investment you are about to make in any given company.
Market Prospects Uses
Market prospect ratios are important in assessing what investors might receive from any investment. These market ratios show future dividends, capital gains, and earnings. They also help to identify stocks that are overvalued or undervalued.
Through the analysis of recent trends and by understanding these market ratios, investors can make great picks of the businesses that will provide great returns.
Related: Characteristics of a good market
List of the Types of Market Value Ratios
- Business Valuation
- Dividend Yield
- Enterprise Value (EV)
- Dividend Payout Ratio
- Dividend Policy Ratios
- Enterprise Value Multiple
- Gordon Growth Model
- PEG ratio
- Loan-to-Value Ratio (LTV)
- Price-to-Research Ratio
- Price/Book Value Ratio
- Net Asset Value per Share (NAVPS)
- Price to Earnings Ratio (P/E Ratio)
- Price/Sales Ratio
- Stock Price
4 Common Market Prospect Ratios Formulas and Examples
- Price-to-earnings (P/E) ratio
- Price-to-book (P/B) ratio
- Price-to-sales (P/S) ratio
- Enterprise value-to-EBITDA (EV/EBITDA) ratio
Price-to-Earnings Ratio (P/E Ratio)
The P/E ratio is the most commonly used market prospect ratio; it is also called the price-earnings multiple. It measures the relationship between a company’s stock price and its earnings per share (EPS). Comparison of a company’s price earnings ratio with other firms helps to identify value placed on the market of the business.
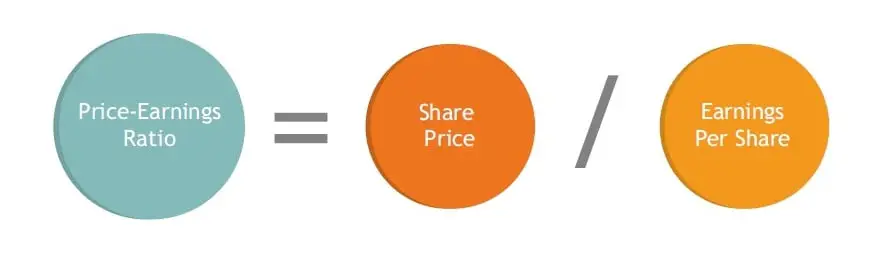
The price-to-earnings ratio or P/E ratio can be calculated by dividing a business’ share price by its earnings per share. It measures how investors are willing to pay per net profit of a company in a given year. A higher value means they are confident that the company would make more in the future. Hence, you can find a company with a high share price but lower earnings because the company knows investors believe in their potential earnings in the future.
How to calculate the price-earning market ratio
- For example, if a company’s stock is selling at $100 per share and the earnings of the company for every share is $10, then its price earnings ratio would be 10. This shows that investors are willing to pay $10 for every $1 of the company’s earnings.
- If Duzzlag had a share price of 320 USD, then our price-earnings ratio calculation would be 320 divided by 40, giving us a price-to-earnings ratio of 8. This simply means that the market value per share of Duzzlag is 8 times the net profit attributable to that share this year. It shows that investors can pay 8 USD for every 1 dollar of net profit that Duzzlag makes.
A high price-to-earnings ratio, when compared with similar businesses in the same industry, shows that investors are paying more because of the profits that the business makes this year; the reason being that they are confident that the profits will still rise in the future. A low price-earnings ratio indicates that investors are not sure of the potential earnings of the company in the future.
Limitations of using P/E ratio
- The P/E ratio does not take into account a company’s future earnings per share.
- The debts of a company are not factored in this ratio analysis.
Related: Debt to Equity Ratio
Earnings Per Share (EPS)
When a firm issues 10 million ordinary shares and its profit after tax is 4 million USD; then the earnings per share would be 4.
Market Prospect Ratio: Formula for EPS
Earnings per share formula = (net profit/number of ordinary shares)
The earnings per share (EPS) of a company is simply the net profit or profit after tax, divided by the number of ordinary shares the company has issued.
This simply means the company has 4 USD of net profit per share that was issued. This can be paid out as dividends or the company can keep it as a profit.
Higher earnings per share mean a greater value of equity for investors; this mostly leads to a rise in the share price.
Price-to-Book Ratio (P/B Ratio)
The price-to-book ratio is also called the market-to-book ratio. The P/B ratio measures the relationship between a company’s stock price and its book value (the value of its assets minus its liabilities). A higher P/B ratio indicates that investors are willing to pay more for a given book value of assets.
How to calculate the price-book market ratio
For example, if a firm has a book value of $1 million and its stock is selling at $10 million, then its P/B ratio would be 10. This means that investors are willing to pay $10 for every dollar of the company’s book value.
Benefits of using the price-book ratio for market prospect analysis
This type of market ratio could help investors to know about the company’s promising profit forecasts and it also shows the investors are willing to pay more for this future projection.
Problems with price-book ratio
The price to book ratio fails to consider the intangible assets of a company such as goodwill, trademarks, brand recognition, copyrights, and patents. These are not physical in nature but in the modern era, they contribute to the valuation of a company.
Price-to-Sales Ratio (P/S ratio)
The P/S ratio is the ratio between a company’s stock price and the sales per share.
How to calculate the price-sales ratio
For example, when a company’s stock is trading at $10 per share and its sales per share are $1, then its P/S ratio would be 10. This shows the investors are willing to pay $10 for every dollar of the company’s sales.
Related: Debt to EBITDA ratio formula and calculation
Enterprise Value-to-EBITDA Ratio – (EV/EBITDA Ratio)
The enterprise value-to-EBITDA (EV/EBITDA) ratio is a measure of how much someone would be willing to pay for a particular business in terms of its cash flow potential. The Enterprise Value (EV) part of the equation takes into account the market value of all aspects of the business such as equity, debt financing, or any form of financing; whereas the EBITDA part shows the earnings before interest, taxes, depreciation, and amortization.
How to calculate the Enterprise Value-EBITDA ratio
Assuming a company has an enterprise value of $1,000,000,000 and an EBITDA of $100,000,000, then the EV/EBITDA ratio would be 10.
Price-Earnings-Growth Ratio (PEG Ratio)
The PEG ratio (price-earnings-growth) is one of the market prospect ratios that compare the stock’s valuation to the earnings growth potential of a company. The higher the PEG ratio, the more expensive the stock price when compared with its earnings growth potential.
Calculating the price to earnings to growth ratio
For example, if one stock of a company has a PEG ratio of 2.0, then is twice as expensive as another company’s stock with the same earning growth potential. It is now left for the investor to ask the question: “why this stock is expensive compared to another stock with the same potential of earnings?”
Earnings yield ratio
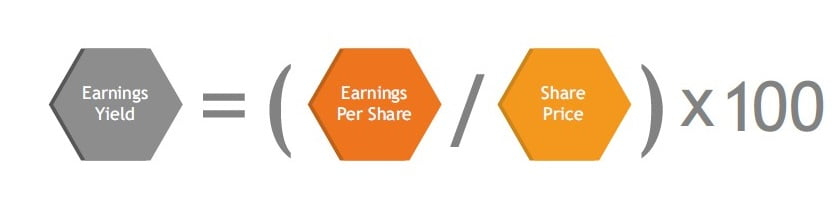
The earnings yield is another type of market value ratio that measures the percentage of the share’s value that is earned as profit. It is the reverse of the price-earning ratio expressed as a percentage.
Formula
The earnings yield formula is calculated by dividing the business’ earnings per share by its share price and then multiplying by one hundred to give a percentage.
Therefore, the earnings yield ratio measures only the percentage of the share’s value that is earned as
net profit.
Calculating earnings yield ratio
If the earnings per share of a company are 40 dollars and the share price is 320 dollars, then the earnings yield ratio would be (40/320) X 100. This gives 12.5%.
Related: Debt to Capital Ratio formula and interpretation
Other Types of Market Prospect Ratios
- Market share ratio
- Market growth rate ratio
- Relative market share ratio
Market share ratio
A market share ratio is a mathematical tool used by analysts and investors to compare the relative size of different companies in the same industry. The market share ratio is calculated by dividing the market value of one company’s stock by the total market value of all companies in the same industry.
The market share ratio can be used to identify which company is the largest in its respective industry, as well as to compare how different companies stack up against each other. For example, if Company A has a market share ratio of 0.50 and Company B has a market share ratio of 0.25, this means that Company A is twice as large as Company B when measured by their respective stock values.
Market growth rate ratio
A market growth rate ratio is a tool used by investors to measure the rate of growth of a particular market. It is calculated by dividing the current market value by the previous year’s market value. The resulting number is then multiplied by 100 to get a percentage.
The market growth rate ratio can be used to compare the rates of different markets or even different sectors within the same market. It can also be used to compare the performance of different investments within the same market.
Investors use this ratio as one factor in deciding whether or not to invest in a particular stock or other security.
Relative market share ratio
A relative market share ratio is a metric used to compare the market share of two or more companies. The ratio is calculated by dividing the market share of each company by the total market share of all companies in the industry.
For example, let’s say Company A has a 20% market share and Company B has a 10% market share. The relative market share ratio would be 2:1 (20%/10%).
This metric is useful for comparing companies within the industry because it takes into account the size of each company.
Dividend cover
One of the important market prospect ratios is the dividend cover; it measures the number of times that a firm can afford to pay dividends to investors.
Formula
The dividend cover formula is derived by dividing a business’ earnings per share by its dividend per share.
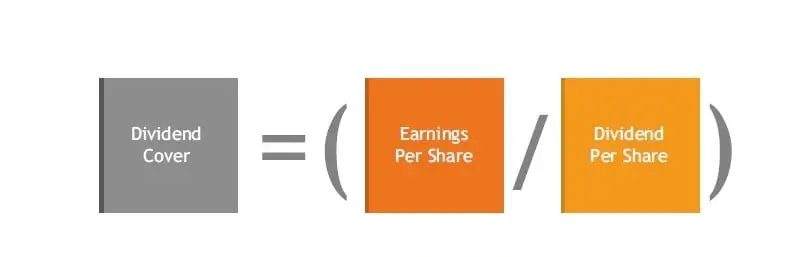
For example, a company with an earning per share of 4 USD and a dividend per share of 2 would have a dividend cover of 2. That means it can afford to pay dividends to investors only twice.
Having a low dividend cover means the company may struggle to pay dividends in the future or it may be paying a large dividend just to maintain the share price.
A business with a high dividend cover can afford to pay dividends many times over; this shows it may be retaining its earnings as profits.
See also: Dividend Yield Payout Ratio
Dividend yield
Dividend yield measures the number of dividends that a shareholder gets for every share he/she owns. It is calculated by dividing a business’ dividend per share by the share price and then multiplying it by 100 to get a percentage.
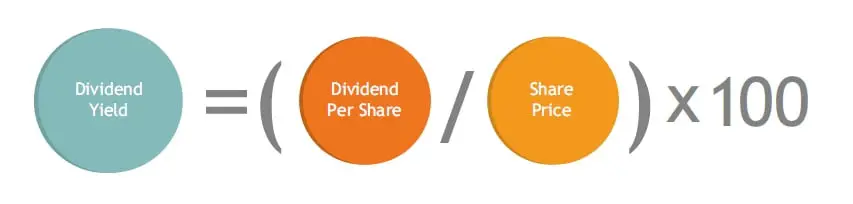
If a company pays a dividend of 20 USD for every share, and the share price is 150, then the dividend yield would be (20/150)X100 = 13.3%. This means that for every worth of share, a shareholder receives 13.3 dollars.
Some businesses prefer to pay high dividends in order to attract investors. These types of stocks are called income stocks. Other companies prefer to invest money for the growth of the company; these types of stocks are known as growth stocks. A low dividend yield does not attract income-seeking investors. In general, the dividend yield ratio cannot be used to value stocks directly but can help investors to know if they want dividend-paying companies or companies that reinvest their net profit for future growth.
Limitations of dividend yield ratio
- The dividend yield ratio can be misleading especially when there is a fall in share price; this may mislead some investors to think there is an increase in dividends.
- There is no guarantee that a company will continue to pay the same number of dividends in the future; in fact, a company may not pay dividends at all. This can affect investors who chase after income stocks, and who are looking for high dividends paying companies.
Market prospect ratios problems
- It can be difficult to interpret some deviations in market value ratios.
- Industry market prospect ratios may not be desirable targets
- Market prospect ratios are affected by seasons.
- Relying on a single market value ratio for investment decisions is not wise. Taking note of some common market prospect ratios can give a better investment understanding and help you to make good investment decisions.
FAQs
How do you calculate market prospect ratio?
There is no single market prospect ratio formula; each type of ratio has its own formula with the needed variable that is used for calculating it.
What are the five market ratios?
The 5 common market ratios used for making investment decisions are P/E Ratio, Dividend Yield Ratio, Market Capitalization, Book Value Per Share, and Price-to-Book Ratio.

Nansel is a serial entrepreneur and financial expert with 7+ years as a business analyst. He has a liking for marketing which he regards as an important part of business success.
He lives in Plateau State, Nigeria with his wife, Joyce, and daughter, Anael.