Investors and analysts make use of several financial metrics to evaluate the financial health of a business. The net profit margin is a typical example of one of such financial metrics. In this article, we will be discussing and looking at some net profit margin examples and interpretations. A business’s net profit margin is calculated as the total number of cents per dollar that is generated on a sale that the business keeps as a profit. This ratio is one of the types of profitability ratios that evaluates the profit level of a company.
As one of the profitability indicators, the net profit margin shows us in percentage, the profitability status of a company. It tells us whether a company is making money or not. This ratio just like the other profit margin ratios gives an insight into the portion of a firm’s sales that is turned into profits and the amount of cents per dollar that the firm generates per sale. Therefore, calculating a company’s net profit margin enables analysts and investors to evaluate the financial health and well-being of the company. We will be discussing what net profit margin is before we look at some net profit margin calculation examples.
Related: Equity Ratio Formula and Calculation
What is the net profit margin?
The net profit margin, also known as the net margin is a profitability ratio that measures how much net income or profit is generated as a percentage of revenue. It is the ratio that compares a company’s net profits to its revenues. The net margin is usually expressed as a percentage but can also be represented in decimal form. This ratio illustrates how much of each dollar in revenue collected by a company is converted into profit.
The net profit margin is an example of a profit margin. There are several types of profit margins such as gross profit margin, operating profit margin, pre-tax profit margin, and net profit margin. The net profit margin is the most commonly used margin amongst the mentioned profit margins. A company’s net profit is what is usually referred to as the company’s bottom line which is the figure that is left over after any taxes and expenses have been deducted from the company’s revenue.
Hence, the net profit margin as a profitability ratio compares a company’s profits to the total amount of money that it brings in and measures how effectively the company operates. This simply means that if a company has a 30% net profit margin, for example, it means that the company keeps $0.30 for every $1 in sales revenue as profit. Therefore, the net profit margin is one of the most crucial indicators of the financial health of a company.
Management by tracking the increases and decreases in a company’s net profit margin can assess whether current practices are working for the company and forecast profits based on revenues. Since companies express their net profit margin as a percentage rather than a dollar amount, it is possible for investors to compare the profitability of two or more businesses regardless of size. Investors can assess if the management of a firm is generating enough profit from its sales and whether operating costs and overhead costs are contained.
For instance, a firm can have growing revenue, but if its operating costs are increasing at a faster rate than revenue, the firm’s net profit margin will shrink. Ideally, investors want to see a track record of expanding margins, which indicates that the net profit margin is rising over time. hence, the majority of publicly traded companies report their net profit margins both quarterly during earnings releases and in their annual reports. Generally, companies that tend to expand their net margins over time are rewarded with share price growth, because share price growth is usually highly correlated with earnings growth.
Hence, the net margin is used to give analysts a picture of a company’s financial stability. Companies that generate greater profit per dollar of sales are more efficient which makes them more likely to survive when a period of economic contraction hits the broader economy or when a product line doesn’t meet expectations. In conclusion, the net profit margin as a profitability ratio includes all factors in a company’s operations, such as:
- Total revenue
- Additional income streams
- Cost of goods sold (COGS) and other operational expenses
- Interest expense on debt obligations
- Investment income and income from secondary operations
- One-time payments for unusual events such as lawsuits and taxes
See also: Debt to EBITDA ratio formula and calculation
Net profit margin formula
The net profit margin formula is the most significant of all the profit margin formulas. In fact, when people ask about a company’s profit margin, they usually refer to the company’s net profit margin. Calculating the net profit margin of a company is quite simple. The net profit margin formula is expressed by dividing a company’s net profits or net income by its net sales or total revenue generated over a given accounting period.
Hence, the net profit margin formula is expressed as:

Net profit margin = {Net Profits (or Income) / Revenue} x 100
OR
Net profit margin (NPM) = {(R − COGS − OE − O − I − T)/ R} x 100
Where,
- R = Revenue
- COGS = Cost of goods sold
- OE = Operating expenses
- O = Other expenses
- I = Interest
- T = Taxes
According to the net profit margin formula, you subtract the cost of goods sold (COGS), operating expenses, other expenses, interest (on debt), and taxes payable from the net sales or total revenue on the income statement to get the net income (or profit). Then, divide the result by the total revenue (or net sales). In order to convert the resulting figure to a percentage, multiply it by 100.
Alternatively, you can simply locate a company’s net income from the bottom line of the income statement and then divide the figure by its revenue (top-line figure). Then, convert the figure to a percentage by multiplying it by 100.
Related: Income Statement Ratios Formulas and Examples
Net profit margin example and interpretation
The figure that results after calculating a company’s net profit tells us about the profitability of a company. Let’s look at an example of net profit margin calculation and possible interpretations of a high or low net profit margin. For a net profit margin ratio example, assume a company has a total revenue of $20,000 and has total expenses that add up to $10,000 with the following expense breakdown:
- COGS- $4,500
- Operating expenses- $2,500
- Other expenses- $1,500
- Interest- $1000
- Taxes: -$500
In order to calculate the company’s net profit margin, we will have to plug the pieces of information given into the profit margin formula below:
Net Profit Margin = {(Revenue – COGS – Operating Expenses – Other Expenses – Interest – Taxes) / Revenue} x 100
Net Profit Margin = {($20,000 – $4,500 – $2,500 – $1,500 – $1000 – $500) / $20,000} x100
= {($20,000 – $10,000) / $20,000} x 100
= {$10,000 / $20,000} x 100
= 0.50 x 100 = 50%
This means that the company has a net profit margin of 50%. However, if on the income statement of the company, we can already see the company’s net income amount, we can skip the process of subtracting the company’s expenses from revenue as we did above and just simply divide the company’s net income by its revenue, then multiply the figure by 100.
From the calculation done, it is obvious that this company has a high net profit margin. A higher net profit margin is preferable because it indicates that the company is generating more profits from its sales. However, it is important to note that net profit margins vary by industry. Growth companies tend to have a higher net profit margin compares to retail companies. However, retail companies tend to make up their lower net profit margins with higher sales volumes.
The net profit margin includes all the factors that influence profitability; both the ones that are under management control and the ones that are not. The higher the net profit margin ratio, the more effective a company is at cost control. When compared with the industry average, the net profit margin of 50% calculated above, tells investors how well the management and operations of the company are performing against its competitors. Also, when the ratio is compared with different industries, it tells investors which industries are relatively more profitable than others. Hence, net profit margin analysis is used as a common method for business valuation.
Furthermore, a net profit margin may not always be a positive figure; it is possible for a company to have a negative net profit margin. This negative figure arises when a company records a loss on the income statement for the quarter or year. However, this recorded loss may just be a temporary issue for the company and could be a result of recessionary periods, increases in the cost of labor and raw materials, and the introduction of disruptive technological tools. Such occurrences could affect the company’s bottom line and result in a negative net profit margin.
High net profit margin
A high net profit margin is an indication that a business is pricing its products correctly and exercising good cost control. In general, a net profit margin that is more than 10% is considered excellent, though it would depend on the industry and the structure of the business. A higher net profit margin is preferable because it indicates that the company is generating more profits from its sales. However, there are some instances where this is not always the case.
For example, the net profit margin of a company can be radically skewed by the presence of unusually large non-operating gains or losses. If for instance, there is a large gain on the sale of a division, a high net profit margin will result even though the operating results of the company are poor. Also, the management of a company could deliberately cut back on the discretionary expenses that impair the ability of the business to compete over the long term in order to increase the company’s net profit margin. Typical examples of discretionary expenses include equipment maintenance, research and development, and marketing.
Furthermore, a company can show a high-profit margin if it applies a net operating loss carryforward to its before-tax profits. Alternatively, a company’s management might attempt to accelerate the recognition of non-cash expenses in order to minimize the amount of tax liability that it must record in the current accounting period. Therefore, a specific tax-related scenario like this can significantly impact the net profit margin.
Low net profit margin
Generally, a net profit margin that is less than 10% may not be considered too good, though this judgment is subject to the kind of industry that the company belongs to and the structure of its business. For instance, a low net profit margin in an industry, such as groceries, might be acceptable, because inventory turns over so quickly. Whereas, it may be necessary for other industries to earn a high net profit margin in order to generate enough cash flow to buy fixed assets or fund working capital.
There are some situations that result in low net profit margins such as in leveraged situations and accounting compliance. In leveraged situations, a company may prefer to grow with debt financing rather than equity financing. In such a case, it will incur significant interest expenses, which will decrease its net profit margin. This means that a financing decision has an impact on a company’s net profit margin.
For accounting compliance, a company in order to be in compliance with various accounting standards may accrue revenue and expense items that may give an incorrect picture of its cash flows. Hence, a large depreciation expense may result in a low net profit margin, even though the company’s cash flows are high.
Read also: Financial leverage ratios and formula
Net profit margin examples
The net profit margin of a company can be calculated using its income statement. We will be showing net profit margin examples using the income statement of different well-known companies. Using the pieces of information on the income statement, we will calculate the company’s net profit margin for 2019 and 2020 to ascertain the company’s rate of growth in the aspect of profitability.
How to calculate net profit margin: example 1
For our first example, we will be using the income statement of Tesla as an example of net profit margin:
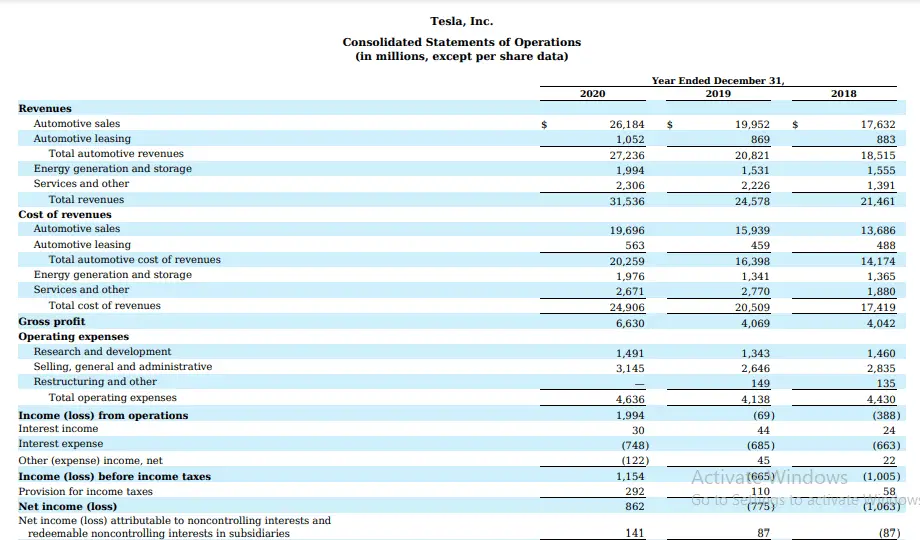
Source: Tesla Form 10-K (Pg 55)
From the Tesla income statement above we have the following figures (all figures above are in millions) for the year, 2019:
- Total revenue – $24,578
- Net income- $775
Using the information above here is how to calculate the net profit margin for Tesla for FY 2019:
Solution
Using the formula,
Net profit margin = (Net Income / Total Revenue) x 100
= ($775 / $24,578) x 100
= 0.0315 × 100 = 3.15%
Hence, Tesla had a net profit margin of 3.15% for the year 2019
For the year 2020, we have the following figures (all figures above are in millions) from the Tesla income statement:
- Total revenue – $31,536
- Net income- $862
Using the information above here is how to calculate Tesla’s net profit margin for FY 2020:
Net profit margin ratio example
Using the formula,
Net profit margin = (Net Income / Total Revenue) x 100
= ($862 / $31,536) x 100
= 0.0273 × 100 = 2.73%
Hence, Tesla had a net profit margin of 2.73% for the year 2020
Tesla’s net profit margin example and interpretation: From, the calculation done above, in 2019, Tesla had a net profit margin of 3.15% and in the next year, 2020, had a net profit margin of 2.73%. This shows a decrease in net profit margin over the years, which may not be a good sign to investors. However, the decrease in Tesla’s net profit margin in 2020 could be attributed to the Covid pandemic that caused an economic downturn to the state of the economy. During the pandemic, jobs were cut, and people tend to save more. Due to this, manufacturers of luxury cars and products were affected and seemed to have fewer people patronizing their business.
In addition, Tesla’s low net profit margin may be acceptable based on its industry. Some businesses tend to have a low-profit margin such as operation-intensive businesses, agriculture-based ventures, and automobiles. Automobile businesses tend to have low-profit margins because profits and sales are limited by factors like intense competition, uncertain consumer demand, and high operational expenses. In conclusion, the 3.15% and 2.73% net profit margins calculated indicated that for every dollar generated by Tesla in sales, the company kept $0.03 and $0.02 as profit in 2019 and 2020, respectively.
How to calculate net profit margin: example 2
For our second example, we will be using the income statement of Amazon to calculate net profit margin:
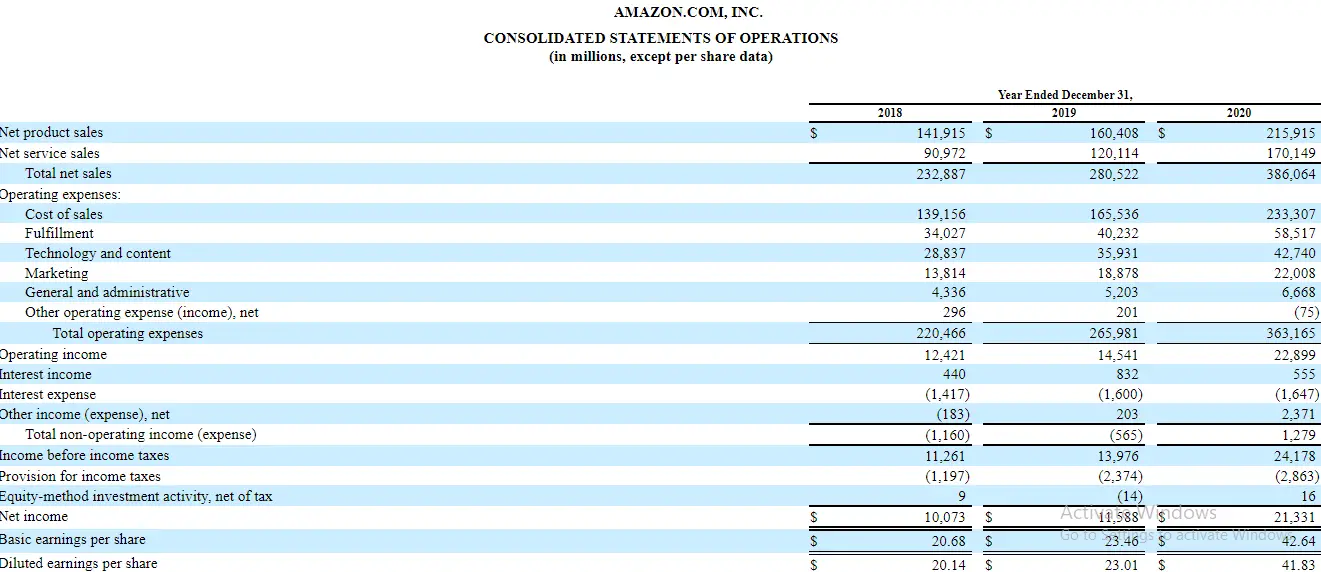
Source: U.S. Securities and Exchange Commission
From Amazon’s income statement above, we have the following figures (all figures above are in millions) for the year, 2019:
- Total net sales – $280,522
- Net income- $11,588
Using the information above here is how to calculate the net profit margin for Amazon for FY 2019:
Solution
Using the formula,
Net profit margin = (Net Income / Net sales) x 100
= ($11,588 / $280,522) x 100
= 0.0413 × 100 = 4.13%
Hence, Amazon had a net profit margin of 4.13% for the year 2019
For the year 2020, we have the following figures (all figures above are in millions) from Amazon’s income statement:
- Total Net sales – $386,064
- Net income- $21,331
Using the information above here is how to calculate Amazon’s net profit margin for FY 2020:
Solution
Using the formula,
Net profit margin = (Net Income / Net sales) x 100
= ($21,331 / $386,064) x 100
= 0.0552 × 100 = 5.52%
Therefore, Amazon had a net profit margin of 5.52% for the year 2020
Amazon’s net profit margin example and interpretation: From, the calculation done above, in 2019, Amazon had a net profit margin of 4.13% and in the next year, 2020, had a net profit margin of 5.52%. This shows a significant increase in the company’s net profit margin over the years, which is a good sign for investors. This is because ideally, investors want to see a track record of expanding margins, which indicates that the company’s net profit margin is rising over time. In conclusion, the 4.13% and 5.52% net profit margin indicates that for every dollar generated by Amazon in sales, the company kept $0.04 and $0.05 as profit in the year, 2019 and 2020, respectively.
How to calculate net profit margin: example 3
For our net profit margin example 3, we will be using the coca-cola income statement:
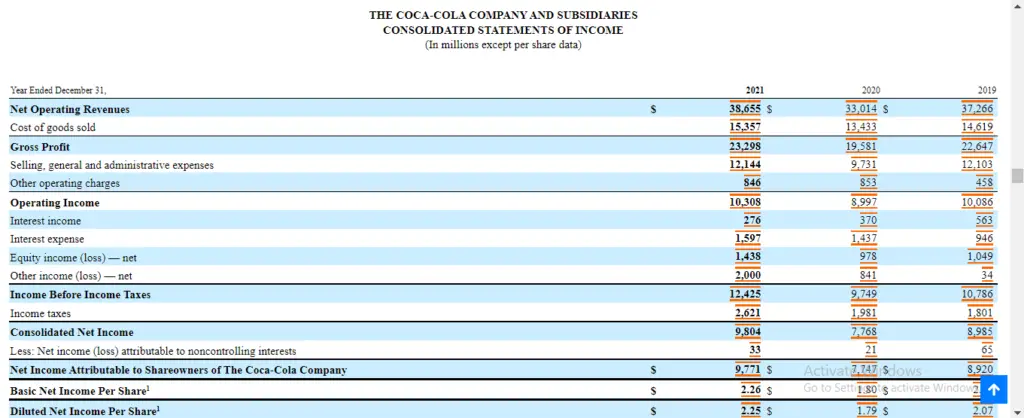
Source: SEC
From the Coca-cola income statement above, we have the following figures (all figures above are in millions) for FY 2019:
- Net revenue – $37,266
- Net income- $8,985
Using the information above here is how to calculate the profit margin for Coca-cola for FY 2019:
Solution
Using the formula,
= {Net Income / Net Revenue} x 100
= ($8,985 / $37,266) x 100
= 0.2411 × 100 = 24.11%
Hence, Coca-cola had a net profit margin of 24.11% in 2019
For the FY 2020, we have the following figures (all figures above are in millions) from the Coca-cola income statement:
- Net revenue – $33,014
- Net income- $7,768
Using the information above here is how to calculate the profit margin for Coca-cola for FY 2020:
Solution
Using the formula,
= {Net Income / Net Revenue} x 100
= ($7,768 / $33,014) x 100
= 0.2352 × 100 = 23.52%
Therefore, Coca-cola had a net profit margin of 23.52% in 2020
Coca-cola’s net profit margin example and interpretation: From, the calculation done above, in 2019, Coca-cola had a net profit margin of 24.11% and in the next year, 2020, had a net profit margin of 23.52%. This shows a decrease in the company’s net profit margin, which could be attributed to the Covid pandemic that caused an economic downturn to the state of the economy.
Also, Coca-cola tends to show a higher net profit margin compared to Tesla and Amazon. A higher profit margin is preferable because it means the company generates more profits from its sales. This high margin could also be a result of the business sector that Coca-Cola belongs to. Some business sectors tend to have high-profit margins compared to others such as software or gaming companies, finance, beverage, and patent-secured businesses.
In conclusion, the 24.11% and 23.52% net profit margin indicates that for every dollar generated by Coca-cola in sales, the company kept $0.24 and $0.23 as profit in 2019 and 2020, respectively.
Last Updated on November 4, 2023 by Nansel Nanzip Bongdap
Obotu has 2+years of professional experience in the business and finance sector. Her expertise lies in marketing, economics, finance, biology, and literature. She enjoys writing in these fields to educate and share her wealth of knowledge and experience.