Price to research ratio (PRR) is used to compare the expenses of a company on R&D to its market value. The idea of the price to research ratio formula and calculation is that once a company spends more on research and development (R&D) in relation to its market value, it signals a greater effort of the company toward innovation. The company is likely to continue creating long-term value.
What is a price to research ratio?
The price to research ratio (PRR) is a ratio that measures the relationship between the market capitalization of a company and its research and development (R&D) expenditures. It is calculated by dividing a company’s market value by its R&D expenditures in the last 12 months. The price to research ratio is expressed as a comparison between a company’s expenditure on research and development and the value of its current share price.

What is the market capitalization in the price to research ratio?
Market capitalization is the market value of the company and not the book value. The market value is gotten by multiplying the total number of shares outstanding by the current stock prices. Shares outstanding are the types of stocks that are currently held by all shareholders including the institutional investors and restricted shares. The market capitalization of a company can be found on Google, Yahoo, or other financial sites and can be calculated by multiplying the total number of shares by the share value.
What is the R&D expense in the price to research ratio?
The definition of research and development (R&D) expenses may differ from industry to industry. However, companies in the same industry commonly use 1 year of R&D expenses. Hence, in the price to research ratio, the total R&D expense is calculated for the last 12 months.
The R&D expenses of a company can be found in different places based on whether the company falls under GAAP (Generally Accepted Accounting Principles) or IFRS (International Financial Reporting Standards). Depending on what regulatory body the company falls under, one may need to look at the balance sheet as well as the income statement of the company.
The research and development expenditures may include expenses related to things like technology licensing, pure research, the cost of getting innovations through regulatory hurdles, or the purchase of proprietary technology from third parties. The R&D expenses are normally disclosed in the income statement or relevant footnotes of published accounting statements.
Use and interpretation of the price to research ratio
The price to research ratio was developed by Kenneth Fisher, a financial expert/writer, to measure and compare the relative R&D expenses of companies. It is a ratio that compares the amount of money a firm spends on research and development in relation to its market capitalization.
This ratio is therefore essential in research-intensive businesses such as software companies, hardware companies, pharmaceutical companies, and consumer products companies. In such research-intensive industries, investment in scientific and technical innovation is important for success and long-term growth. Moreso, it can be a crucial indicator that the company has the ability to generate profits in the future.
According to Kenneth Fisher, it is advisable to buy companies with PRRs that are between 5 and 10 and avoid companies with PRRs that are greater than 15. The essence of looking for a lower price to research ratio is that investors will be able to tell companies that are redirecting current profits into R&D, thus, ensuring better long-term future returns.
A lower price-to-research ratio may be considered appealing, because it may indicate that the company is heavily invested in research and development. As a result, it is probably more likely to succeed in producing future profitability. On the other hand, a relatively higher price to research ratio may indicate that the company is not investing enough in future success. However, a company with a lower price-to-research ratio firm may just have a lower market capitalization, and not necessarily a better investment in research and development.
Therefore, a relatively favorable price-to-research ratio does not necessarily guarantee the success of future product innovations. Similarly, a large amount of R&D spending doesn’t guarantee future profits. The most important thing is how effectively the company is employing its R&D dollars. Furthermore, the appropriate level of R&D spending varies by industry and is based on the development stage of the company. As with all ratio analyses, the PRR should be seen as one piece of a large mosaic of data that is used to inform an investment opinion.
Price to research ratio formula
The price to research ratio is calculated by dividing the market capitalization by the R&D expenses. This is measured on a trailing twelve-month (TTM) basis and uses diluted shares outstanding.
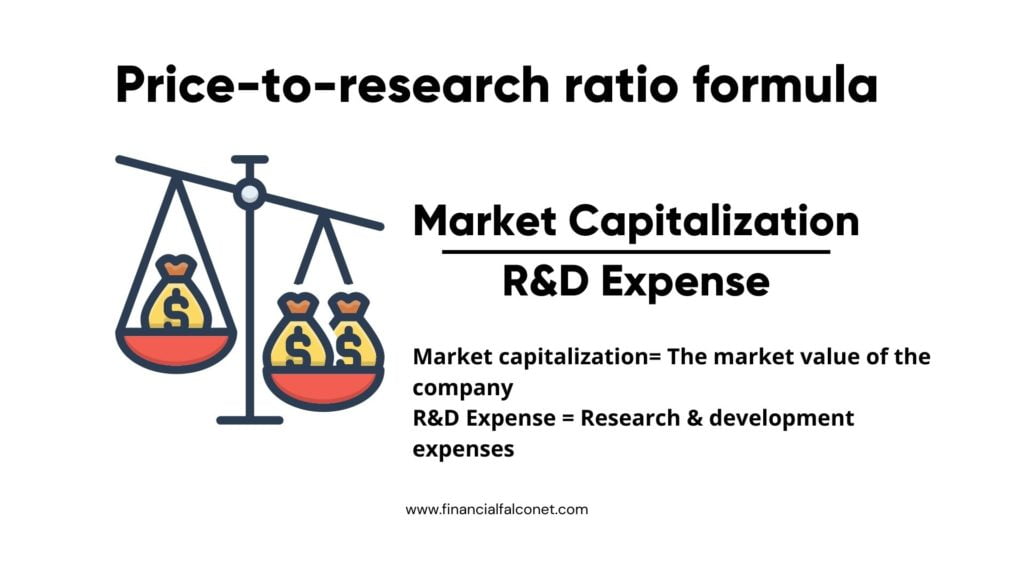
The Price to research ratio formula is expressed as:
Price-to-Research Ratio = Market capitalization / R&D expense
The market capitalization can be calculated by multiplying the total number of shares by the share value.
Price to research ratio calculation
The price to research ratio calculation is used to value a company against the amount it spends on R&D and is one of the ways of evaluating the company’s ability to generate future profits. This is because research and development is a sign of commitment made by a company to innovation. Hence, a lower price-to-research ratio (i.e. a higher denominator) may indicate a greater value of a company in relation to its innovative activities. For instance, Amazon and Alphabet spent the most in 2018 on R&D at 22.6 billion and 16.2 billion respectively.
The price-to-research ratio calculation evaluates the stock price held by a company in comparison to its capacity for generating future profits from new products. This price-to-research ratio of a company can give insight into companies competing within the same industry. Hence, the R&D intensity ratio can vary widely and an interpretation of a high or low price-to-research ratio calculation should be made within this context.
Here are a few examples of price to research ratio calculations:
Example 1
A textile company, for instance, spent $5,000,000 the previous year on research and development. If the company has 10,000,000 outstanding shares trading at $5. Let’s calculate the price to research ratio for this textile company.
Using the PR Ratio formula,
Price-to-Research Ratio = Market capitalization / R&D expense
Where;
Market Capitalization= 10,000,000 x $5 = $50,000,000
R&D Expense= $5,000,000
Therefore,
Price-to-Research Ratio =$50,000,000 / $5,000,000 = 10
This means the price to research ratio of this textile company is 10.
Example 2
Supposing that the previous year, Company XYZ spent $20,000,000 on R&D and it has 10,000,000 outstanding shares trading at $10. Let’s find the price-to-research ratio:
Using the price to research ratio formula,
Price-to-Research Ratio = Market capitalization / R&D expense
Where;
Market Capitalization= 10,000,000 x $10 = $100,000,000
R&D Expense= $20,000,000
Therefore,
Price to research ratio =$100,000,000 / $20,000,000
=5
This means the price to research ratio of company XYZ is 5.
Example 3
For example, let’s assume that a certain IT Company spent $2,500,000 on R&D last year. It has 5,000,000 shares outstanding trading at $10. What will be the price-to-research ratio of the IT company?
Using the Price to research ratio formula,
Price-to-Research Ratio = Market capitalization / R&D expense
Where;
Market Capitalization= 5,000,000 x $10 = $50,000,000
R&D Expense= $2,500,000
Therefore,
Price to research ratio =$50,000,000 / $2,500,000
=20
This means the price to research ratio of the IT company is 20.
Limitations of the price to research ratio formula
In as much as the PR Ratio helps investors identify companies that are committed to research and development, it has limitations. One of the major limitations is that the ratio doesn’t indicate whether the R&D expenses have the desired effect which is the successful creation of profitable products over time.
The price to research ratio does not measure the effectiveness with which management allocates capital. For example, a large R&D bill does not guarantee new product launches, nor does it guarantee that market implementations will generate profits in future quarters. Hence, investors when evaluating R&D should determine how much is invested and how well the R&D investment is working for the company.
Furthermore, companies usually cite patent output as a tangible research and development success measure. The reasoning is that the more patents filed, the more productive the R&D department is. However, in reality, the ratio of patents per R&D dollar tends to point out the activity of the lawyers and administrators of a company more than its engineers and product developers. Moreover, there is no guarantee that a patent will ever turn into a marketable product.
Disadvantages
- A higher price to research ratio may indicate the opposite that the company is not making enough investment in future success.
- The R&D expenses used in calculating the ratio are not a guarantee that future profits from that R&D will ever materialize.
- The price to research ratio doesn’t measure how effectively management allocates capital.
- Research and development intensity can vary widely.
Advantages of the price to research ratio calculation
- The price to research ratio is a measure used to compare the R&D expenditures of companies.
- It is useful for planning to generate future profit.
- The PRR measures how effectively R&D expenditures translate into viable products or sales growth.

Obotu has 2+years of professional experience in the business and finance sector. Her expertise lies in marketing, economics, finance, biology, and literature. She enjoys writing in these fields to educate and share her wealth of knowledge and experience.