A PEG ratio calculation is a stock valuation measure used by analysts and investors. The PEG ratio formula entails the price/earnings to growth ratio. Analysts and investors use this PEG ratio to get a broad assessment of a company’s performance and evaluate investment risk. PEG ratio is one of the equity multiples and a type of market value ratio.
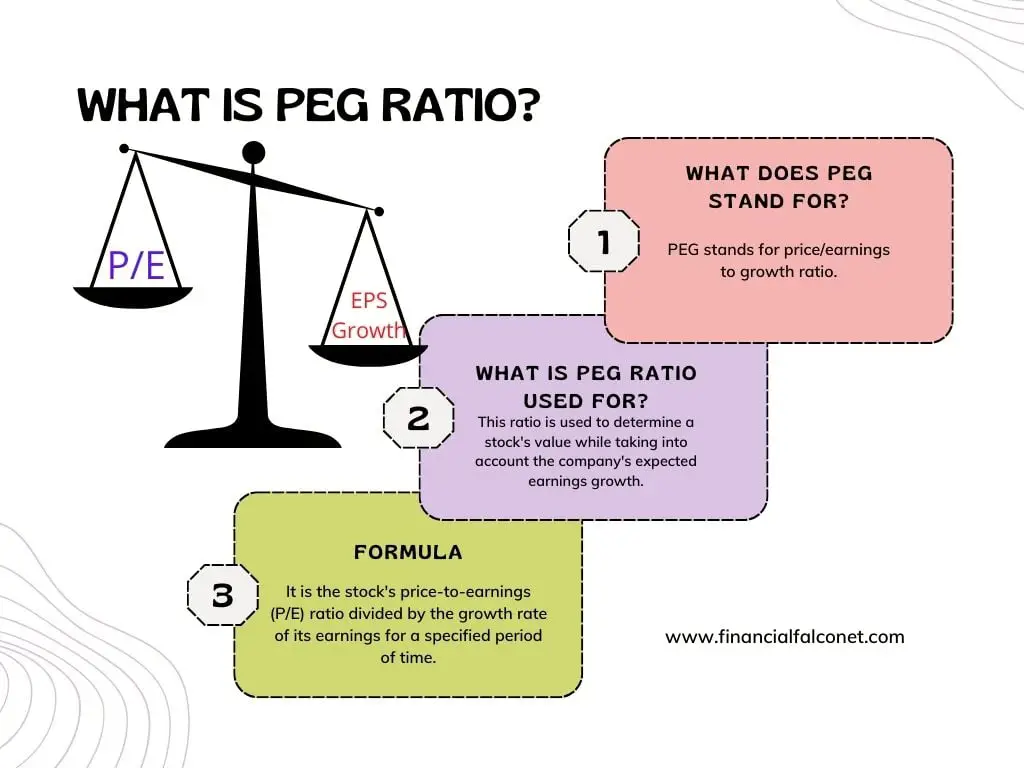
What does PEG stand for?
PEG stands for price/earnings to growth ratio. It is the price-to-earnings (P/E) ratio of a stock divided by the growth rate of its earnings for a specified period of time.
What is PEG Ratio?
The PEG ratio is a valuation metric for determining the relative trade-off between a stock price, the earnings generated per share (EPS), and the company’s expected growth. It is the stock’s price-to-earnings (P/E) ratio divided by the growth rate of its earnings for a specified period of time.
This ratio is used to determine a stock’s value while taking into account the company’s expected earnings growth. PEG ratios are thought to provide a more complete picture than the more standard P/E ratio. Generally, a company with a higher growth rate will have a higher P/E. Hence, using just the P/E ratio would make high-growth companies appear overvalued in relation to other companies.
When comparing companies with different growth rates, it is better to divide the P/E ratio by the earnings growth rate. This resulting PEG ratio is considered to be a convenient approximation. This means that the PEG ratio of stocks when comparing companies would vary based on the company’s earnings growth rate and the companies with the best PEG ratio tend to attract investors.
What is considered a good PEG ratio?
Investors look out for stocks with good PEG ratio range. As a general rule, a PEG ratio of 1.0 or lower would suggest that a stock is fairly priced or even undervalued while a PEG ratio that is above 1.0 would suggest that a stock is overvalued. Hence, investors who rely on the PEG ratio, look for stocks that have a P/E ratio (price to earnings) equal to or less than the company’s expected growth rate.
A low P/E ratio may make a stock look like a good buy but when you factor in the company’s growth rate to get the stock’s PEG ratio may indicate something contrary. The lower the PEG ratio the more the stock may be undervalued factoring in its future earnings expectations. Hence, adding the expected growth of a company into the ratio helps to adjust the result for the companies that may have a high growth rate and a high P/E ratio. A resulting PEG ratio interpretation as high or low can indicates an over or underpriced stock.
Therefore, the degree to which a PEG ratio result indicates an over or underpriced stock would vary by company and industry type. Some investors feel that a PEG ratio below one is desirable and this has become a broad rule of thumb.
According to Peter Lynch, a well-known American investor, a company’s P/E and expected growth should be equal, which indicates a fairly valued company and supports a PEG ratio of 1.0. This means that when a company’s PEG exceeds 1.0, it’s considered overvalued, whereas a stock with a PEG of less than 1.0 is considered undervalued.
Hence, a low PEG ratio is generally a better indicator of a buy. A PEG ratio under 1.0 particularly suggests that the stock price is not currently accounting for expected earnings growth. Conversely, a high PEG ratio which is above 1.0 points to a stock price that isn’t necessarily supported by growth forecasts. However, investors shouldn’t rely exclusively on the PEG ratio or any other single financial metric because the fact that a company’s PEG ratio is greater or less than 1.0 doesn’t mean it’s a bad or a good investment.
PEG ratio calculation
In order to calculate the PEG ratio, an analyst or investor needs to either calculate or look up the P/E (price-to-earnings) ratio of the company in question.
This P/E ratio is calculated by dividing the price per share of the company by the earnings per share (EPS), or price per share / EPS.
Once the P/E has been calculated, the next thing is to find the expected growth rate for the stock in question. This can be done using analyst estimates available on financial websites that follow the stock. Once found, put the figures into the PEG formula, and solve for the PEG ratio number.
PEG ratio formula
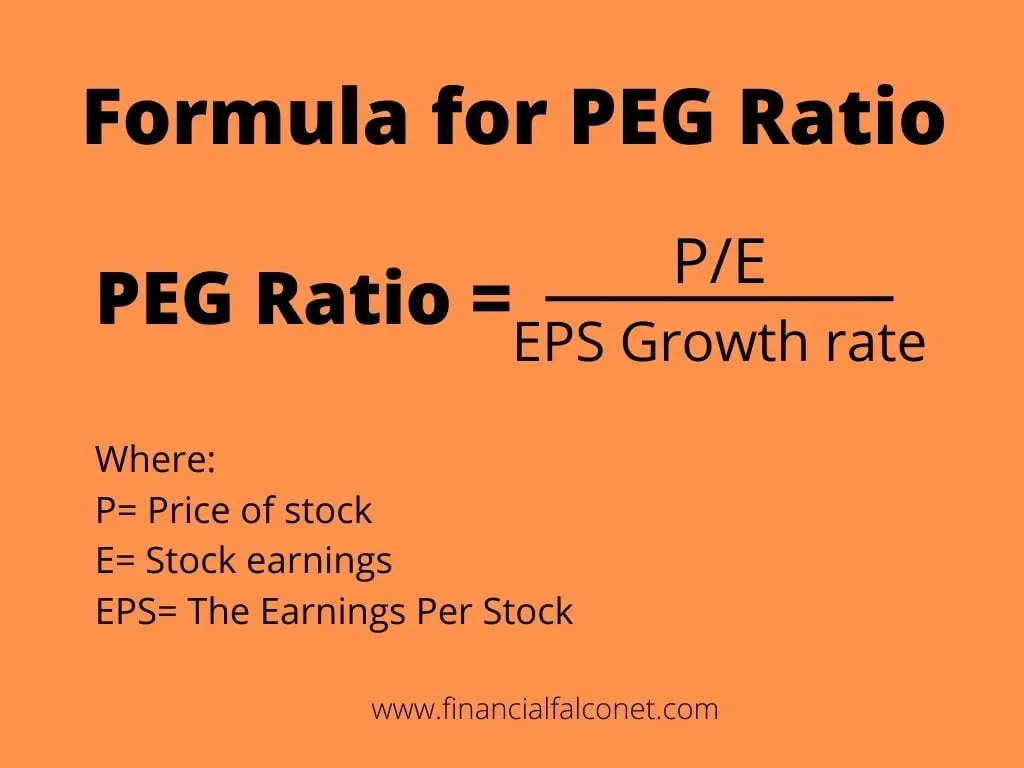
PEG Ratio= (P/E) / EPS Growth rate
where:
P= Price of stock
E= Stock earnings
P/E= Price to earnings (P/E ratio)
EPS = The earnings per stock
The EPS Growth rate is expressed as a percent value and should use real growth only, to correct for inflation. For instance, if a company is growing at 50% a year, in real terms, and has a P/E of 50, it would have a PEG of 1. The P/E ratio used in the PEG ratio calculation may be projected or trailing. Moreso, the annual growth rate may be the expected growth rate for the next year or the next five years.
How to calculate PEG ratio
Using the formula:
PEG Ratio= (P/E) / EPS Growth rate
Using the above formula, we can calculate the PEG ratio of stocks from companies.
Calculating PEG ratio example
Take, for instance, an investor who wants to choose between two stocks from companies in the same industry, he may want to look at their PEG ratios to make his decision.
Now, if the stock of Company A can trade for a price that is 15 times its earnings, whereas the stock of Company B can trade for 18 times its earnings. The investor may simply look at the P/E ratio, and may see Company A as the better option.
However, Company A has a projected five-year earnings growth rate of 12% per year whereas Company B’s earnings have a projected growth rate of 19% per year for the same period of five years.
Now, let’s calculate to see what their PEG ratio calculation would look like:
For Company A
PEG= 15/12%= 1.25
For Company B
PEG= 18/19%=0.95
From the resulting PEG ratio calculation, it is seen that when possible growth is taken into account, Company B could be a better option for the investor. This is because it is actually trading for a discount compared to its value.
Company B has a PEG ratio of less than 1 which implies that the company’s stock is undervalued whereas Company A has a PEG ratio that is more than 1 which implies that the company’s stock is overvalued.
Accuracy in PEG ratio calculation
Like every other ratio, the accuracy of the PEG ratio depends on the inputs used. When considering a company’s PEG ratio, it’s crucial to find out which growth rate was used in the calculation. For instance, using historical growth rates may provide an inaccurate PEG ratio if future growth rates are expected to deviate from a company’s historical growth. You can calculate the PEG ratio using one-year, three-year, or five-year expected growth rates. However, in order to differentiate between calculation methods using future growth and historical growth, the terms forward PEG and trailing PEG are sometimes used respectively.
Advantages
The advantage of the PEG ratio to investors is that it explicitly puts a value on the expected growth in earnings of a company. It can offer a suggestion of whether a company’s high P/E ratio reflects an excessively high stock price. Moreso, it can offer a reflection of promising growth prospects for the company.
Drawbacks and limitations of the PEG ratio formula
One of the drawbacks of the PEG ratio is that it doesn’t take into account other factors that can help determine a company’s value. For instance, the PEG doesn’t look at the amount of cash a company keeps on its balance sheet. If the cash is a large amount, it could add value to the company.
Therefore, there are other factors that analysts consider when evaluating stocks such as the price-to-book ratio (P/B) ratio. This ratio can help them ascertain if a stock is genuinely undervalued or if the growth estimates used to calculate the PEG ratio are simply inaccurate. In order to calculate the P/B ratio, analysts divide the stock’s price per share by its book value per share.
Furthermore, there are some limitations to the PEG Ratio. As earlier said, getting an accurate PEG ratio calculation would depend highly on the factors used in the calculations. Investors may discover that PEG ratios are inaccurate if they use historical growth rates, especially if future ones may deviate from the past.
FAQs
What is a good PEG ratio?
Investors would interpret a good PEG ratio as one that is less than 1. In theory, a PEG ratio value of 1 interprets a perfect correlation between the market value of a company and its projected earnings growth. The PEG ratios that are higher than 1.0 are generally considered unfavorable, which suggests that a stock is overvalued. Hence, ratios lower than 1.0 are considered better, which indicates a stock is undervalued.
What is PEG ratio in stocks?
The PEG ratio is a stock valuation that helps investors value a stock by taking into account a company’s market price, its earnings, and its future growth prospects. A PEG ratio calculation can evaluate how expensive a stock is by comparing the company’s stock price to its earnings and earnings growth rate. This ratio can offer a more complete picture of whether a stock is overvalued or undervalued.
What is a good PEG ratio for stocks?
Investors look out for stocks with a good PEG ratio. As a general rule, a PEG ratio of 1.0 or lower would suggest that a stock is fairly priced or even undervalued while a PEG ratio that is above 1.0 would suggest that a stock is overvalued.
What does a negative PEG ratio mean?
A negative PEG ratio means the company is losing money or is expected to have negative growth. This kind of ratio can arise from a negative P/E ratio, or negative earnings growth estimates.
What should be the ideal PEG ratio?
A PEG ratio that is lower than 1.0 is considered ideal, which indicates that a stock is undervalued.
Is a higher PEG ratio better?
The PEG ratios that are higher than 1.0 are generally considered unfavorable because it suggests that a stock is overvalued. Hence, ratios lower than 1.0 are considered better, which indicates a stock is undervalued.

Obotu has 2+years of professional experience in the business and finance sector. Her expertise lies in marketing, economics, finance, biology, and literature. She enjoys writing in these fields to educate and share her wealth of knowledge and experience.