The liquidity ratio formula is a financial tool like the debt to equity ratio formula and the interest coverage ratio formula that is used to determine if a business has the ability to pay its short-term loans. This tool is important in corporate finance because every business that wants to thrive must pay its loans both in the short and long term.
The calculations will be given in relatable examples that can be seen in the everyday business world. But first, what is the ratio all about?
What is the liquidity ratio?
The liquidity ratio is a financial metric that shows if a company or a business can pay its short-term debt without raising cash (capital) from outside. In essence, it measures if a business is liquid, that is if it can quickly exchange its tangible assets for cash.
Liquidity ratios are most useful when used in comparison by financial managers, and this comparison could be internal or external. For example, internal comparison or analysis of liquidity ratios entails using various accounting cycles that are reported using the same accounting techniques. In doing so, analysts can track business changes by evaluating past cycles of current operations.
External comparison or analysis, on the other hand, entails comparing the liquidity ratios of one company to another or an entire industry. When establishing benchmark goals, this information can be used to compare the company’s strategic positioning to that of its competitors. When looking across industries, liquidity ratio analysis may not be as effective because different businesses require different financing structures.
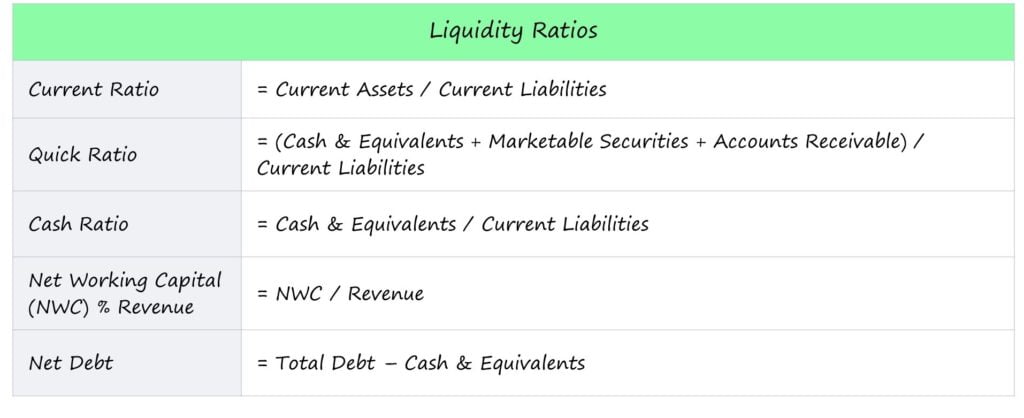
Liquidity ratio formula
- Cash ratio
- Current ratio
- Quick ratio
- Net Working Capital (NWC) % Revenue
- Net Debt
The formulas for the above-listed ratios can be used to calculate liquidity ratios. These formulas will be explained below.
Cash ratio
The cash ratio only takes into account a company’s most liquid assets, which are cash and marketable securities. They are the assets that a company has the most readily available to pay short-term obligations. This ratio is the most conservative measure of liquidity among the ratios listed. If the cash ratio is 1.0x, the company has exactly enough cash and cash equivalents to pay off short-term liabilities, so anything higher is a good sign (i.e., cash and equivalents are adequate).
This liquidity ratio formula is expressed as Cash Ratio = (Cash + Marketable Securities)/(Current Liabilities)
Current ratio
The current ratio compares current assets to current liabilities. The goal is to see if there are enough current assets on hand to cover current liabilities if the current assets are liquidated. Its major problem is that it includes inventory as a current asset. Inventory may be difficult to convert into cash and thus may not be a good indicator of liquidity.
This liquidity ratio formula is expressed as Current Ratio = Current Assets / Current Liabilities
Quick ratio
The quick ratio is similar to the current ratio, but it does not include inventory; instead, it considers more liquid assets such as cash, accounts receivable, and marketable securities. As a result, current assets such as inventory and prepaid expenses are excluded because they are less liquid. This is possibly the best liquidity ratio for determining whether a company has enough short-term assets on hand to meet its current obligations.
This liquidity ratio formula is expressed as Quick Ratio = (Cash & Equivalents + Marketable Securities + Accounts Receivable) / Current Liabilities
or
Quick ratio = (Current assets – Inventory – Prepaid expenses) / Current liabilities
Net Working Capital (NWC) % Revenue
The NWC metric indicates whether a company has cash locked up in operations or enough cash to meet its short-term working capital requirements. Net working capital (NWC) equals current operating assets minus current operating liabilities (excluding cash and equivalents).
Higher NWC/Revenue ratios indicate that more current assets are locked up in the business, reducing liquidity – for example, the company is having difficulty collecting cash payments from customers who paid on credit or selling off inventory. Having said that, a negative NWC is preferable to a positive NWC in terms of liquidity.
The formula for liquidity for this is given as:
NWC % Revenue = NWC / Revenue
Net Debt
The net debt metric calculates how much of a company’s short-term and long-term debt obligations can be paid off right now with the cash on its balance sheet. Net debt is not a liquidity ratio (it includes long-term debt), but it is still a useful metric for assessing a company’s liquidity. If two similar companies have the same amount of debt in their capital structure, but one has a lower net debt balance, it can be assumed that the latter has more liquidity (and reduced risk).
The formula for liquidity for this is given as:
Net Debt = Total Debt – Cash & Equivalents
Liquidity ratio examples
Some examples of liquidity ratios and their subsequent calculations will be given below.
Calculation of liquidity ratio
Liquidity ratio calculation is very important in corporate finance. This calculation is done to determine if a business can pay its short-term loans. The calculation of this ratio will be based on some of the formulas listed previously.
How to calculate liquidity ratio using cash ratio
Liquidity ratio example 1
The financials of a sports brand are shown in the table below. Calculate this sports brand’s cash ratio and explain what it tells you.
| Balance sheet items | Amount in $ |
| Cash & Cash Equivalents | 100 million |
| Accounts Receivable (A/R) | 65 million |
| Inventory | 50 million |
| Accounts Payable | 40 million |
| Short-Term Debt | 85 million |
Solution
Because we are calculating for cash ratio, we will exclude the accounts receivable and inventory accounts from the financials listed. This leaves us with $100 million in cash and cash equivalents.
In addition, the sports brand has $85 million in short-term debt and $40 million in accounts payable, both of which are near-term debts (i.e. vendor financing), for a total current liability of $125 million.
How to calculate the cash ratio of a sports brand using the cash ratio formula:
Cash Ratio = 100 / 125
Cash Ratio = 0.8
Interpretation of cash ratio: The sports brand has a cash ratio of 0.8, which is less than one. This means that the company’s cash and cash equivalents are insufficient to cover its liabilities with near-term maturity dates. Nonetheless, given that the company has a $50 million inventory balance and a $65 million accounts receivable balance, it is unlikely that the company will default on its debt obligations or vendor payments in the worst-case scenario.
Liquidity ratio example 2
What is Company ABC’s cash ratio if it has $600,000 in cash and $1,000,000 in cash equivalents on its balance sheet at the end of May and $1,200,000 in current liabilities?
Solution
From the financials given, Company ABC has cash & cash equivalents of ($600,000 + $1,000,000).
The company has current liabilities of $1,200,000.
How to calculate the liquidity ratio of Company ABC using the cash ratio formula:
Cash Ratio= (Cash + Marketable Securities) / Current Liabilities
Cash Ratio= ($600,000 + $1,000,000) / $1,200,000
Cash Ratio= 1,600,000 / 1,200,000
Cash Ratio= 1.33
Cash ratio interpretation: In this liquidity ratio example, company ABC has a cash ratio of 1. This means that the cash and cash equivalents of the company are exactly enough to pay off its short-term debt.
Liquidity ratio example 3
Calculate the cash ratio assuming a company with a current liabilities of $270,000 has the following balance sheet data:
| Assets | Amount |
| CURRENT ASSETS | |
| Cash on hand | $45,000 |
| Cash in bank | $35,000 |
| Marketable securities | $50,000 |
| Inventory | $70,000 |
| Accounts receivable | $95,000 |
| Prepaid insurance | $25,000 |
| TOTAL CURRENT ASSETS | $320,000 |
| NON-CURRENT ASSETS | |
| Fixed assets | $100,000 |
| Goodwill | $40,000 |
| TOTAL NON-CURRENT ASSETS | $140,000 |
Solution
According to the data in the balance sheet, the company has $320,000 in total current assets. However, because we are calculating for cash ratio, we will exclude inventory, accounts receivable, and prepaid insurance from our calculation. This leaves us with $130,000 in cash and cash equivalents. i.e Cash on hand and Cash in bank ($45,000 + $35,000) + Marketable securities of $50,000= $130,000
The company has current liabilities of $270,000.
How to calculate the liquidity ratio of the Company using the cash ratio formula:
Cash Ratio= (Cash + Marketable Securities) / Current Liabilities
Cash Ratio= $130,000 / $270,000
Cash Ratio= 0.48
Interpretation of cash ratio: The company has a cash ratio of 0.48, which is less than one. This means that the company’s cash and cash equivalents are insufficient to cover its liabilities with near-term maturity dates. Nonetheless, with an inventory balance of $70,000 and an accounts receivable balance of $95,000, the company is unlikely to default on its debt obligations or vendor payments in the worst-case scenario.
How to calculate liquidity ratio using the current ratio
Example 1
Company A and Company B are two of the most influential players in the home entertainment manufacturing industry. Calculate the current ratios of Companies A and B using the figures from their balance sheets for the fiscal year ending in 2020.
| Balance sheet items | Company A | Company B |
| CURRENT ASSETS: | ||
| Cash and cash equivalents | $40,000 | $60,000 |
| Inventories | $70,000 | $20,000 |
| Accounts receivable | $25,000 | $55,000 |
| Total current assets | $135,000 | $135,000 |
| CURRENT LIABILITIES: | ||
| Accounts payable | $85,000 | $30,000 |
| Short-term notes payable | $50,000 | $90,000 |
| Wages payable | $25,000 | $40,000 |
| Total current liabilities | $160,000 | $160,000 |
Solution
Using the current ratio equation:
Current ratio = Current Assets / Current Liabilities
Calculating the current ratio for Company A will be:
Current ratio = $135,000 / $160,000 = 0.844
Calculating the current ratio for Company B will be:
Current ratio = $135,000 / $160,000 = 0.844
Liquidity ratio analysis of this example: In the current ratio calculation for Company A and Company B, it is seen that both have a current ratio value of 0.844, which is less than 1, indicating that these companies may not have enough current assets to settle their short-term obligations. Even though these two companies appear to be similar, Company B is likely to be in a more liquid and solvent position based on the following balance sheet observations:
- Company A has significantly more inventory than Company B, which may be more difficult to convert into cash in the short term. This inventory could be overstocked or unwanted, which would reduce its value on the balance sheet.
- Company B has a larger cash reserve than Company A. Cash is the most liquid asset, and Company A has more accounts receivable, which could be collected faster than inventory liquidation.
- In terms of assets, while the total value of current assets for both companies is the same, Company B is more liquid and solvent.
Furthermore, even though Company A and Company B have the same total current liabilities, they are very different because Company A has more accounts payable and Company B has a greater amount in short-term notes payable.
More research may be required because it is possible that the accounts payable must be paid before the entire balance of the notes-payable account. More importantly, Company B has fewer wages payable, which is the liability that is most likely to be paid in the near future.
Notwithstanding, an investor can delve deeper into the details of these companies’ current ratio comparisons by evaluating other liquidity ratios that are more narrowly focused than the current ratio, such as the quick ratio.
Example 2
What will the current ratio analysis of a technology company with the following balance sheet details be?
| Balance sheet items | Amount |
| CURRENT ASSETS: | |
| Cash and cash equivalents | $47,000,000 |
| Inventories | $40,000,000 |
| Marketable securities | $30,000,000 |
| Total current assets | $117,000,000 |
| CURRENT LIABILITIES: | |
| Accounts payable | $25,000,000 |
| Short-term debt | $35,000,000 |
| Total current liabilities | $60,000,000 |
Solution
Using the formula for the current ratio:
Current ratio = Current Assets / Current Liabilities
Calculating the current ratio for the tech company will be:
Current ratio = $117,000,000 / $60,000,000 = 1.95
Current ratio interpretation example: It means that this tech firm has a current ratio of 1.95 indicating that it can easily settle $1 of its debts or accounts payable. This suggests financial well-being for the technology company.
How to calculate liquidity ratio using quick ratio
Example 1
Company A and Company B are two major players in the food industry.
- Calculate the quick ratios of Companies A and B using the figures in the table below from their balance sheets for the fiscal year ending in 2021.
- Which of these companies is more liquid and solvent?
| Balance sheet items | Company A | Company B |
| CURRENT ASSETS: | ||
| Cash and cash equivalents | $40,000 | $68,000 |
| Accounts receivable | $25,000 | $55,000 |
| Inventories | $70,000 | $12,000 |
| Total current assets | $135,000 | $135,000 |
| CURRENT LIABILITIES: | ||
| Accounts payable | $85,000 | $30,000 |
| Short-term notes payable | $50,000 | $90,000 |
| Wages payable | $25,000 | $40,000 |
| Total current liabilities | $160,000 | $160,000 |
Solution
Using the formula for quick ratio:
Quick ratio = (Current assets – Inventory – Prepaid expenses) / Current liabilities
Calculating the quick ratio for Company A will be:
Quick ratio = ($135,000 – $70,000) / $160,000 = 0.406
Calculating the quick ratio for Company B will be:
Quick ratio = ($135,000 – $12,000) / $160,000 = 0.768
The quick ratio calculation for Companies A and B shows that Company A has a quick ratio of 0.406 while Company B has a higher quick ratio value of 0.768. As we can see, the quick ratio gives us a better understanding of these companies’ short-term liquidity. Company B is likely more liquid and solvent than Company A, as evidenced by a higher quick ratio.
Furthermore, the following balance-sheet observations demonstrate why Company B is more liquid and solvent than Company A:
- Company B has fewer stocks than Company A. Company A has significantly more inventory that may be difficult to convert into cash in the short term. Furthermore, there is a chance that this inventory is unwanted or overstocked, which may reduce its value on the balance sheet.
- Cash is the most liquid asset, and Company B has more cash than Company A.
- Even though Company A has more accounts receivable that can be collected faster than liquidating inventory, Company B is better off with more cash and less inventory.
- Besides the fact that the two companies have the same total value of current assets, Company B is in a more liquid, solvent position.
Furthermore, even though Company A and Company B have the same current liabilities, they are very different. Company A has a higher balance in accounts payable, whereas Company B has a higher balance in short-term notes payable. Further investigation may be required because the accounts payable may have to be paid before the entire balance of the notes-payable account. Furthermore, Company A has fewer wages payable, which is the most likely liability to be paid in the near future.
Example 2
Calculate the quick ratio for a technology firm with a financial statement like that of Apple in 2020 with $180,000 in current liabilities.
| Assets | Amount |
| CURRENT ASSETS | |
| Cash on hand | $45,000 |
| Cash in bank | $35,000 |
| Short-term investments | $50,000 |
| Inventory | $70,000 |
| Accounts receivable | $95,000 |
| Prepaid insurance | $25,000 |
| TOTAL CURRENT ASSETS | $320,000 |
| NON-CURRENT ASSETS | |
| Fixed assets | $100,000 |
| Goodwill | $40,000 |
| TOTAL NON-CURRENT ASSETS | $140,000 |
Solution
Using the formula for quick ratio:
Quick ratio = (Current assets – Inventory – Prepaid expenses) / Current liabilities
First, let’s solve to get the numerator in the quick ratio formula above:
(Current assets – Inventory – Prepaid expenses)= $320,000 – $70,000 – $25,000= $225,000
Quick ratio= $225,000 / $180,000= 1.25
According to the calculations, the company’s quick ratio is 1.25. This ratio is greater than one, indicating that the company has sufficient liquid assets to cover its current liabilities.
What is a good liquidity ratio?
Anything greater than one is considered a good liquidity ratio. It indicates that the company is financially sound and is less likely to face financial difficulties. The higher the ratio, the greater the company’s ability to meet its current liabilities.
Liquidity ratio analysis
- Liquidity ratio of one
- Liquidity ratio of less than one
- Liquidity ratio over one
One of the three financial indicators listed above, the liquidity ratio, can reveal.
Liquidity ratio of 1
If a company’s current assets equal its current liabilities, it has a liquidity ratio of one. In essence, its current assets could pay for all of its current short-term debt.
Liquidity ratio of <1
If a company’s liquidity ratio is less than one, it lacks sufficient cash (or cash equivalents) to meet its short-term debt obligations. A liquidity ratio of 0.75, for example, indicates that the company only has enough cash on hand to cover 75% of its short-term liabilities. This could indicate a liquidity crisis.
Liquidity ratio of >1
If a company’s current ratio is greater than one, it has more than enough liquid assets to cover its balance sheet’s short-term debts. A liquidity ratio of two, for example, indicates that the company has enough cash assets (or the equivalent) to cover its liabilities twice over.
Importance
- Determine the ability to cover short-term obligations
- Determine creditworthiness
- Determine investment worthiness
Determine the ability to cover short-term obligations
Liquidity ratios help investors and creditors determine whether a company can meet its short-term obligations and to what extent. A ratio of one is preferable to a ratio of less than one, but it is not ideal. Higher liquidity ratios, such as 2 or 3, are preferred by creditors and investors. The higher the ratio, the more likely it is that a company can pay its short-term bills. A ratio of less than one indicates that the company has negative working capital and may be experiencing a liquidity crisis.
Determine creditworthiness
Creditors use liquidity ratios to determine whether or not to extend credit to a company. They want to ensure that the company to which they lend can repay them. Any indication of financial insecurity may preclude a company from obtaining loans.
Determine investment worthiness
Investors will use liquidity ratios to determine whether a company is financially healthy and worthy of its investment. Low liquidity ratios are a red flag, but the adage “the higher, the better” is only true to a point. Investors will eventually wonder why a company’s liquidity ratios are so high. Yes, a company with a liquidity ratio of 8.5 will be able to pay its short-term bills with confidence, but investors may consider such a ratio excessive. A high ratio indicates that the company has a large number of liquid assets.
For example, if a company’s cash ratio was 8.5, investors and analysts might think it was excessive. The company has too much cash on hand, which is earning nothing more than the interest rate offered by the bank to hold their cash. It could be argued that the cash should be allocated to other initiatives and investments that will yield a higher return.
Liquidity ratios strike a balance between a company’s ability to safely cover its bills and inefficient capital allocation. Capital should be allocated in the most efficient manner possible to increase the firm’s value for shareholders.
Liquidity ratios vs solvency ratios
Solvency ratios, as opposed to liquidity ratios, assess a company’s ability to meet its total financial obligations and long-term debts. Solvency refers to a company’s overall ability to pay debts and continue business operations, whereas liquidity is more concerned with current or short-term financial accounts.
To be solvent, a company must have more total assets than total liabilities; to be liquid, a company must have more current assets than current liabilities. Although solvency is not directly related to liquidity, liquidity ratios provide a preliminary estimate of a company’s solvency.
A company’s solvency ratio is calculated by dividing its net income and depreciation by its short-term and long-term liabilities. This metric indicates whether a company’s net income is sufficient to cover its total liabilities. In general, a company with a higher solvency ratio is regarded as a better investment.
Conclusion
Companies require liquidity to pay their bills. Companies can determine if they can meet their short-term obligations by using the liquidity ratio formula to calculate the liquidity metric. When comparing the financial strength of companies in the same industry, liquidity ratios are also useful. Liquidity differs from solvency, which assesses a company’s ability to pay off all of its debts.
Last Updated on November 6, 2023 by Nansel Nanzip Bongdap
Nansel is a serial entrepreneur and financial expert with 7+ years as a business analyst. He has a liking for marketing which he regards as an important part of business success.
He lives in Plateau State, Nigeria with his wife, Joyce, and daughter, Anael.