An asset turnover ratio is a ratio that compares the total amount of a company’s net sales in dollar amount to the total amount of assets that was used to generate the stated amount of net sales. This means that an asset turnover ratio interpretation tells us how efficiently the assets of a company are deployed to generate revenue. Therefore, a higher value of this ratio is usually interpreted as a company using its assets well enough to generate its net sales or revenue. In this article, we will discuss the asset turnover ratio interpretation and how to interpret it with examples.
Related: Net Profit Margin Examples and Interpretation
Asset turnover ratio explained
The asset turnover ratio is an efficiency ratio that measures the ability of a company to generate revenue from its assets by comparing the company’s net sales with its average total assets. The asset turnover ratio interpretation can be used as an indicator of a company’s efficiency in using its assets to generate revenue. That is, the ratio interprets how efficiently a company can use its assets to generate revenue.
This asset turnover ratio is also called the total asset turnover ratio and is mostly calculated on an annual basis. As a company’s total revenue is increasing, the asset turnover ratio can identify whether the company is becoming more or less efficient at using its assets effectively to generate profits.
The ratio calculates the company’s net sales as a percentage of its average total assets to show how many sales are generated from each dollar of the company’s assets. For instance, an asset turnover ratio interpretation of 1.5 would mean that each dollar of the company’s assets generates $1.5 in sales.
Hence, the asset turnover ratio formula is expressed as:
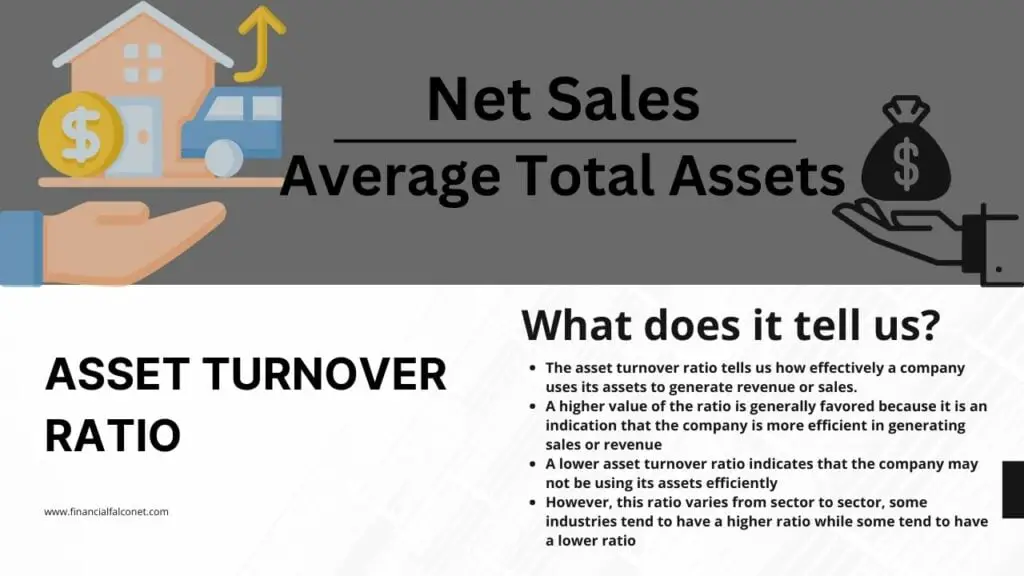
Asset Turnover Ratio = Net Sales / Average Total Assets
Where;
- Net Sales= Total sales (i.e the total annual sales)
- Average Total Assets= (Beginning Assets + Ending Assets) / 2
- Beginning Assets= Assets at the start of the year
- Ending Assets= Assets at end of the year
That is the asset turnover ratio can also be expressed as:
Asset Turnover Ratio = Net Sales / [(Beginning Assets + Ending Assets) / 2]
Read also: Types of Profitability Ratios and Formulas
Asset turnover ratio interpretation
The asset turnover ratio interpretation is relevant when evaluating the efficiency of a company’s operation. This ratio tells us how effectively a company is using its assets to generate revenue or sales for an accounting period. Hence, the interpretation of the asset turnover ratio means the higher the ratio, the more efficient a company is at generating revenue from its assets. That is, an interpretation of an asset turnover ratio of 1.5 would mean that each dollar of the company’s assets generates $1.5 in sales.
However, it is important to note that the asset turnover ratio would vary throughout different business sectors due to the varying nature of different industries. Therefore, for a comparative asset turnover ratio interpretation to be valid, only the ratios of companies that are in the same sector should be compared. Hence, it would not be proper to compare this ratio for businesses in different sectors.
As the asset turnover ratio varies across business sectors, some industries tend to have a higher ratio while some tend to have a lower ratio. Also, publicly-facing industries such as retail and restaurants tend to have a higher asset turnover ratio because they depend heavily on converting assets to inventory, and then converting inventory to revenue.
Other business sectors like real estate normally take long periods of time to convert inventory into revenue. Hence, the industry-wide asset turnover ratio is usually low even though real estate transactions may result in high-profit margins.
High asset turnover ratio interpretation
It is generally preferable for the interpretation of asset turnover ratio to be a higher value. A high asset turnover ratio indicates that the company is more efficient in generating revenue from its assets. If the asset turnover ratio of a company is greater than 1, it is considered a high ratio.
This is a good ratio for the company because it indicates that the company can generate enough revenue for itself. However, interpreting this value as being good will also depend on the average asset turnover ratio of the industry to which the company belongs.
For instance, in the retail industry, the businesses’ total assets are usually kept low and as a result, most businesses’ average ratio in the retail industry is usually over 2. If a company belongs to the retail industry and has an asset turnover of 1.5, for example, it is interpreted that the company is not doing well. Also, a high asset turnover ratio interpretation may not necessarily always mean efficiency. Management can attempt to make a company’s efficiency seem better on paper than it actually is by selling off assets.
Selling off assets has the effect of artificially inflating the asset turnover ratio. Hence, companies can artificially inflate their asset turnover ratio by selling off assets. Selling off assets will improve the asset turnover ratio of the company in the short term because revenue (which is the numerator of the ratio formula) increases as the company’s assets (which is the denominator of the ratio formula) decreases.
However, this affects the company in a way, because it then has fewer resources to generate sales in the future. Also, by changing depreciation methods for fixed assets, a similar effect occurs on the asset turnover ratio because this will change the accounting value of the firm’s assets.
Low asset turnover ratio interpretation
If the asset turnover ratio of a company is less than 1, it is said to have a low ratio. This is not considered good for the company because it indicates that the company’s total assets cannot produce enough revenue at the end of the accounting period (usually a year). However, this interpretation and conclusion still depend on the average asset turnover ratio of the industry to which the company belongs.
If a company’s industry has an asset turnover that is less than 0.5 like in most cases and the company’s ratio is 0.9; then the company is doing well, irrespective of its low asset turnover.
On the other hand, if a company’s industry has an asset turnover that is greater than 1 and the company’s ratio is 0.9; then the company is not doing well. In this case, a lower asset turnover ratio indicates that the company may not be using its assets efficiently. It may be an indication that the company is not efficiently using its assets to generate sales. Generally, a low asset turnover ratio interpretation suggests that the company has problems with surplus production capacity, poor inventory management, or bad tax (or revenue) collection methods.
Related: Income Statement Ratios Formulas and Examples
What is a good asset turnover ratio?
As mentioned earlier, the asset turnover ratio varies between companies in different industries or sectors. Hence, there’s no universally accepted figure that can be considered a ‘good’ asset turnover ratio. For instance, in the utility sector, an asset turnover ratio that is between 0.25 – 0.5 is acceptable whereas, in the retail sector, an asset turnover ratio of 2.5 or more is considered a good ratio.
This simply means that whether a company’s asset turnover ratio is considered good or poor would depend on its industry as well as the value of the asset turnover from the company’s previous records. Nonetheless, generally, an asset turnover ratio result that is higher than those in the same industry would be interpreted as the company being better at moving products to generate revenue.
See also: Debt to EBITDA ratio formula and calculation
Examples of how to interpret asset turnover ratio
In order to understand how to interpret asset turnover ratio, we will look at an example. We will calculate the asset turnover ratio for four companies in the telecommunication-utilities and retail sectors for FY 2020 and compare them. We will be using the financial statements of Walmart Inc. (WMT), Target Corporation (TGT), AT & T Inc. (T), and Verizon Communications Inc. (VZ) for this example.
Calculating asset turnover ratio for Walmart, Target, AT & T, and Verizon
From the 2020 financial statements (income statement and statement of financial position) of Walmart Inc., Target Corporation, AT & T Inc. (T), and Verizon Communications Inc. (VZ), we have the following details and calculations:
| (in $ million) | Walmart | Target | AT & T | Verizon |
|---|---|---|---|---|
| Beginning Assets (Assets at the start of the year that was carried over from 2019) | $219,295 | $42,779 | $551,669 | $291,727 |
| Ending Assets (Assets at the end of the year for 2020) | $236,495 | $51,248 | $525,761 | $316,481 |
| Average Total Assets [(Beginning Assets + Ending Assets) / 2] | $227,895 | $47,014 | $538,715 | $304,104 |
| Net sales (in $ million) | $523,964 | $93,561 | $171,760 | $128,292 |
| Asset turnover ratio | 2.29 | 1.99 | 0.31 | 0.42 |
That is, using the asset turnover ratio formula:
Asset turnover ratio = Net sales / Average Total Assets
- Walmart’s asset turnover ratio = $523,964 ÷ $227,895 = 2.29
- Target’s asset turnover ratio = $93,561 ÷ $47,014 = 1.99
- AT & T’s asset turnover ratio = $171,760 ÷ $538,715 = 0.31
- Verizon’s asset turnover ratio = $128,292 ÷ $304,104 = 0.42
Asset turnover ratio interpretation for Walmart, Target, AT & T, and Verizon
From the asset turnover ratio calculation done, Walmart, Target, AT & T, and Verizon had an asset turnover ratio of 2.29, 1.99, 0.31, and 0.42 respectively. Recall that the asset turnover ratio is most useful when compared across similar companies. Therefore, it would not make sense to compare the asset turnover ratios for Walmart or Target with that of AT&T or Verizon, because they operate in very different industries.
Hence, comparing the asset turnover ratios for AT&T with Verizon or that of Walmart with Target is more acceptable and provides a better estimate of which company is using its assets more efficiently in that industry.
Low asset turnover ratio interpretation for AT & T and Verizon
Let’s look at how to interpret asset turnover ratio for AT & T and Verizon. As we can see from the calculation done, Verizon and AT&T both had an asset turnover ratio of less than one. In as much as this is considered a low ratio, it is not a bad thing because of the business sector that these companies belong to.
AT & T and Verizon both operate in the telecommunications-utilities sector and a low asset turnover ratio is acceptable for companies in this sector. This is because companies in this industry have large asset bases, and it is expected that they would turn over their assets through sales, slowly.
Also, we can see from the calculation that Verizon has a higher ratio than AT& T. When comparing these two companies, the asset turnover interpretation would be that Verizon turns over its assets at a faster rate than AT&T. In addition, from the asset turnover ratio calculation done, it is interpreted that for every dollar in assets, AT & T generated $0.31 in sales, while Verizon generated $0.42.
High asset turnover ratio interpretation for Walmart and Target
Let’s look at how to interpret asset turnover ratio for Walmart and Target. As we can see from the calculation done, Walmart and Target both had an asset turnover ratio that is greater than one. Walmart and Target have a high asset turnover ratio because they are both in the retail industry. Publicly-facing industries such as retail and restaurants tend to have a higher asset turnover ratio. This explains why the asset turnover ratio of Walmart and Target is way higher than Verizon and AT &T for the same year.
From the calculation done, it is interpreted that for every dollar in assets, Walmart generated $2.29 in sales, while Target generated $1.99. Compared to Walmart, Target’s asset turnover is low which could be an indication that the retail company was experiencing sluggish sales or holding obsolete inventory.
Target’s low turnover may also mean that the company may have a long collection period which results in higher accounts receivable. However, it could also mean that Target, Inc. may not be using its assets efficiently; probably the company’s fixed assets could be sitting idle or not being utilized to their full capacity.
Last Updated on November 4, 2023 by Nansel Nanzip Bongdap
Obotu has 2+years of professional experience in the business and finance sector. Her expertise lies in marketing, economics, finance, biology, and literature. She enjoys writing in these fields to educate and share her wealth of knowledge and experience.