Profitability indicators are a class of financial ratios that are used to assess the ability of a business to generate earnings relative to its operating cost, revenue, assets, or shareholders’ equity over time, using the data from a particular point in time. The indicators of profitability in business are one of the essential metrics used in financial analysis.
Financial analysis is an important tool that is used by managers to evaluate the financial situation of the company and make decisions related to its business. Hence, financial metrics provide a basis for financial management or decision-making, though using these metrics may not give you the overall health of a company as its sole focus is on the financial aspects.
There are three broad areas in financial analysis which include profitability analysis, risk analysis, and resource and asset analysis. However, depending on the type of information needed, financial indicators are divided into several types of indicators. Therefore, financial indicators are divided into profitability indicators/ratios, solvency ratios, economic ratios, liquidity ratios, activity ratios, and investment ratios.
Profitability indicators are used for profitability analysis which involves estimating a company’s return on investment. In this article, we will discuss the different types of profitability indicators, their importance, and their interpretation. But first, let’s look at what profitability indicators are.
Related: Income Statement Ratios Formulas and Examples
What are profitability indicators?
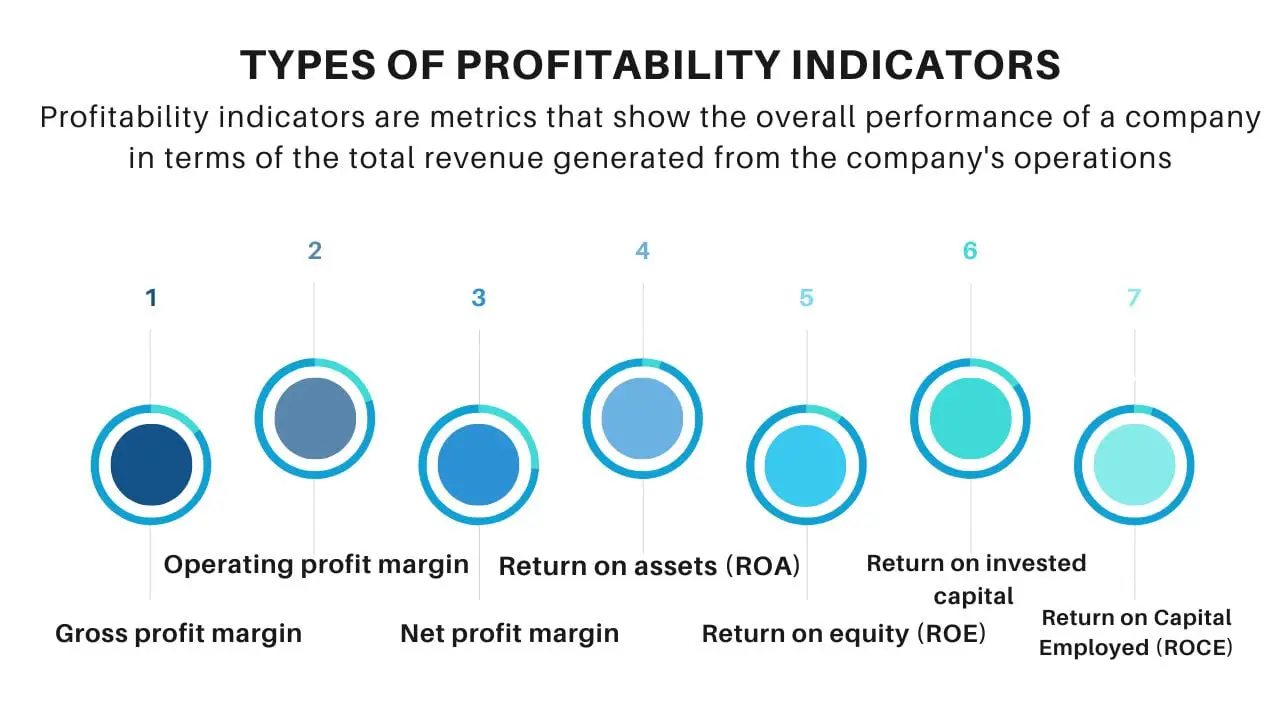
Profitability indicators are ratios that show the overall performance of a company in terms of the total revenue generated from the company’s operations. In other words, they are profitability ratios that measure the capacity of a business to generate profits out of its expenses, and other costs incurred over a period.
Profitability indicators are used for profitability analysis to measure the ability of a company to generate income or earnings relative to the expenses incurred by its business during a particular period. Hence, profitability indicators tell us how well a company is utilizing its assets to generate value for its shareholders.
Profitability indicators include an assessment of the two main sources of profitability which are the margins and turnover. Focusing on the margins (part of sales that are not reimbursed) and turnover (capital utilization) of a business, profitability indicators are of two types namely profit margin ratios and the rate of return ratios.
- Profit margin ratios: Gross profit margin, Operating profit margin, EBIT margin, and Net profit margin
- Rate of return ratios: Return on assets (ROA), Return on equity (ROE), Return on invested capital (ROIC), and Return on Capital Employed (ROCE)
These are the different types of profitability indicators. The profit margin ratios tell us the relationship between a company’s profit and sales, whereas the rate of return ratios tells us the relationship between a company’s profits and investments. Therefore, profitability analysis combines the measurement of a company’s profit margins and return indicators.
The profitability indicators are most often analyzed when conducting financial analysis because they are usually considered the highest management effectiveness. Generally, the ratios with the higher value are favorable because it is an indication that a company is doing well. However, there are different profit levels for different economic areas, and as such, it is important to have a good understanding of the industry or sector that a company belongs. This is necessary so as to ensure that the profitability indicators give a better and more comprehensive overview of a company’s situation.
See also: Equity Ratio Formula and Calculation
What do profitability indicators tell us?
Profitability indicators tell us whether or not a company is making enough operational profit from its assets. They indicate and show us how well a company is using its assets to generate profits. Therefore, a high profitability ratio is favorable because it is an indication that a company is performing well by generating revenues, profits, and cash flow.
That is, a company having a higher value of profitability ratio relative to a competitor’s ratio or relative to the same ratio from a previous period is an indication that the company is doing well. These indicators are most effective when used to compare similar companies in the same industry, a company’s own history, or average ratios of the company’s industry.
Hence, for effectiveness, compare a company’s profitability ratio with the average ratios for the company’s industry, the same ratio from a previous period in the company, or with the ratio of similar companies. This is because there are different profit levels for different industries.
In addition, there are some industries that experience seasonality in their operations. For instance, retailers usually experience significantly higher earnings and revenues during the end-of-year holiday season. As a result, it would not be advisable to compare a retailer’s fourth-quarter gross profit margin with its first-quarter gross profit margin. This would give a less effective profitability result because these periods are not directly comparable.
Gross profit margin is one of the most widely used profitability indicators. Gross profit is the difference between revenue and the costs of production (cost of goods sold COGS). Therefore, comparing a retailer’s fourth-quarter profit margin with its fourth-quarter profit margin from the previous year would be far more better and informative.
Special considerations when using indicators of profitability
In order for profitability indicators to be used properly, it is important to understand
how a particular company operates, most especially from a financial perspective. Also, when
analyzing profitability indicators, some kind of average ratio is required across the industry in order
to get the true image of the company’s financial status.
Managers analyze their company with financial reports from competing companies in order to assess their rate of profitability and risk of competition. This profitability analysis enables mutual comparisons to assess relative strengths and weaknesses and compare performance.
Moreso, when using profitability indicators, it is best to compare a business’s results for the current period to the results for the same period in the preceding year. This is because many businesses have seasonal revenues, which causes their profitability ratios to vary considerably over the course of a year.
Related: Debt to EBITDA ratio formula and calculation
Types of profitability indicators
- Gross profit margin
- Operating profit margin
- EBIT margin
- Net profit margin
- Return on assets (ROA)
- Return on equity (ROE)
- Return on invested capital (ROIC)
- Return on Capital Employed (ROCE)
Gross profit margin
Gross profit margin is one of the profitability indicators that analysts use to assess a company’s financial health. This indicator calculates the amount of money that is left over from the sale of products after subtracting the COGS (also known as the cost of sale). It is frequently expressed as a percentage of sales and the formula is expressed as:
Gross Profit Margin = (Net Sales − COGS)/Net Sales
The gross profit margin percentage is calculated by first subtracting the cost of goods sold (COGS) from the net sales (gross revenues minus sales returns, allowances, and discounts); then dividing the figure by the net sales.
Interpretation
If the gross profit margin of a company fluctuates wildly, it may be a sign of poor management practices or inferior products. However, such fluctuations may be justified in cases whereby a company makes sweeping operational changes to its business model. Hence, in such cases, the temporary volatility wouldn’t pose a problem. Also, product pricing adjustments may also influence a company’s gross margins. That is, if a company sells its products at a premium, with all other things equal, it will have a higher gross margin.
Operating profit margin (EBIT margin)
The operating margin is a profitability indicator that measures how much profit a company makes on a dollar of sales after paying for variable costs of production; before paying interest or tax. This profitability ratio is calculated by dividing a company’s operating income by its net sales. It is also known as EBIT margin, operating income margin, and return on sales (ROS). The formula for operating margin/EBIT margin is expressed as:
Operating Margin = Operating Earnings/Revenue
The operating earnings which is the numerator of the operating margin formula use a company’s earnings before interest and taxes (EBIT). EBIT, or operating earnings, is therefore calculated as the company’s revenue minus the cost of goods sold (COGS) and the regular selling, general, and administrative costs of running a business, excluding interest and taxes.
Interpretation
A company’s operating margin is a good indicator of the proportion of revenues that are available to cover non-operating costs, such as paying interest. A higher operating margin ratio or EBIT ratio is generally better because it shows that a company is efficient in its operation and is good at turning sales into profits. Highly variable operating margins, on the other hand, are a prime indicator of business risk. Hence, looking at the past operating margins of a company is a good way to gauge whether a company’s performance has been getting better.
Net profit margin
The net profit margin (net margin) is one of the common profitability indicators used. It measures the amount of net income or profit that is generated as a percentage of revenue. This indicator illustrates how much of each dollar in revenue collected by a company translates into profit. It includes all factors in a company’s operations, such as:
- Total revenue
- Additional income streams
- COGS & other operational expenses
- Interest expense on debt obligations
- Investment income & income from secondary operations
- One-time payments for unusual events like lawsuits and taxes
Hence, the formula for Net profit margin is expressed as:
Net profit margin = (Net income / Revenue) x 100
= [(R – COGS – E – I – T)/ R] x 100
Where;
- R= Revenue
- COGS= Cost of goods sold
- E= Operating and other expenses
- I= Interest
- T= Taxes
Interpretation
Net profit margin is one of the most important profitability indicators of a company’s financial health. By assessing the increases and decreases in the net profit margin, a company can assess whether current practices are working and forecast profits based on revenues. Net profit margin tells us whether a company’s management is generating enough profit from its sales and whether operating costs and overhead costs are contained.
Return on assets (ROA)
The return on assets ratio (ROA) is also one of the profitability indicators that are commonly used. This ratio measures the profitability of a company in relation to its total assets. It is commonly expressed as a percentage and is used by corporate management, analysts, and investors to determine how a company efficiently makes use of its assets to generate profit. The return on assets ratio is calculated by using a company’s net income and its total or average assets. Hence, the formula is expressed as:
ROA = (Net Income/Total Assets)
Interpretation
The return on assets ratio tells us how efficient a company is in managing its assets into net income. Hence, the higher the ROA of a company, the better. A higher ROA indicates more asset efficiency indicating that a company is more efficient and productive at managing its assets to generate profit. Whereas, a company with a lower ROA may indicate room for improvement.
Companies that have a lower ROA compared to the industry average can be a red flag. This could mean that the management might not be deriving the full potential benefits from its owned assets. Also, companies with a low return on assets ratio tend to have more debt, due to the fact that they need to finance the cost of the assets. However, debt financing may not necessarily be a bad thing, as far as the management uses it effectively to generate income.
Nevertheless, when analyzing ROA, it is important to compare companies in the same industry based on the fact that different industries use assets differently. For example, the ROA for service-oriented firms, like banks, will be significantly higher than the return on assets ratio for capital-intensive companies, like construction or utility companies.
Return on equity (ROE)
Return on equity (ROE) is also one of the profitability indicators that are used to measure a company’s financial performance. It is calculated by dividing net income by shareholders’ equity. ROE is also considered to be a return on net assets. This is because shareholders’ equity is equal to a company’s assets minus its debt.
This indicator is expressed as a percentage and can be calculated if net income and equity are both positive numbers. The net income is calculated before dividends are paid to common shareholders and after dividends and interest are paid to preferred shareholders and lenders, respectively. The formula for this indicator is expressed as:
ROE = Net Income/Average Shareholders’ Equity
Net income is calculated as the amount of income, net expenses, and taxes that a company generates for a given period. Average shareholders’ equity, on the other hand, is calculated by adding equity at the beginning of the period. However, the beginning and end of the period should tally with the period during which the net income is earned.
Interpretation
Return on equity is considered a measure of a company’s profitability and how efficient it is in generating profits. Hence, the higher the return on equity, the more efficient a company’s management is at generating income and growth from its equity financing.
The ROE as a profitability indicator shows the return on equity invested by the owners in the company’s business. It tells us the profits made by the company using the capital invested by the owner. Hence, a higher value of this indicator is more favorable for a company, as it indicates a more powerful ability to generate results per unit of the invested capital.
However, whether an ROE is considered good or bad will depend on what is normal among the company’s peers. Hence, a good rule of thumb is to target an ROE that is equal to or just above the average ROE for the company’s industry. Relatively high or low ROE ratios will vary significantly from one industry to another. Hence, a common way for investors is to consider an ROE that is near the long-term average of the S&P 500 (14%) as an acceptable ratio and consider anything that is less than 10%, as poor.
Return on invested capital (ROIC)
Return on invested capital (ROIC) is a profitability ratio that is used to evaluate a company’s efficiency in allocating capital to profitable investments. Hence, the return on invested capital is calculated by dividing the net operating profit after tax (NOPAT) by the invested capital. Hence, this ratio gives us a view of how well a company is using its capital to generate profits. Therefore, comparing a company’s ROIC with its weighted average cost of capital (WAAC) shows us whether invested capital is being used effectively.
The formula for ROIC is expressed as:
ROIC = NOPAT/Invested Capital
Where; NOPAT=Net operating profit after tax
Another formula for ROIC is:
Return on invested capital= (Net income – Dividends)/(Debt + Equity)
Interpretation
ROIC is expressed as an annualized or trailing 12-month value and is compared to a company’s cost of capital to ascertain whether the company is creating value. If the ROIC is greater than a company’s weighted average cost of capital (WACC), then value is being created. Hence, such companies will trade their stocks at a premium.
ROIC is one way to determine whether or not a company has a defensible economic moat. An economic moat is the ability of a business to protect its profit margins and market share by maintaining competitive advantages over new market entrants over the long run. Hence, value investors tend to prioritize the ROIC concept because the majority of them purchase shares under the mindset of a long-term holding period.
Return on Capital Employed (ROCE)
One of the profitability indicators is the return on capital employed (ROCE). This indicator is used to assess the profitability of a company and its capital efficiency. Hence, ROCE can help determine how well a company is generating profits from its capital as it is put to use. This ratio is one of the profitability ratios that financial managers, stakeholders, and potential investors use when analyzing a company for investment.
The formula for ROCE is expressed as:
ROCE = EBIT/Capital Employed
Where:
- EBIT=Earnings before interest and tax
- Capital Employed= Total assets − Current liabilities
Interpretation
ROCE as a profitability indicator shows the amount of profit a company is generating per $1 of capital employed. Therefore, the more profit per $1 a company can generate, the better. This means that a higher ROCE shows stronger profitability. More so, a company’s ROCE trend over the years can also be an important indicator of performance. Investors tend to favor companies that have stable and rising ROCE levels. They tend to avoid companies where ROCE is volatile or trending lower.
Related: Financial leverage ratios and formula
Importance of profitability indicators
Profitability indicators are used to assess whether a company is making enough operational profit from its assets. They relate to efficiency ratios because they tell us how well a company is using its assets to generate profits. It focuses on the sources and levels of the company’s profits, thus, a higher profitability ratio or value would be an indication that the business is performing well by generating revenues, profits, and cash flow.
Another importance of profitability indicators is their ability to point to strategic changes in business, investment, and financing. They are like symptoms; they do not clearly identify where and what exactly the problem is in a business, but rather enable managers and analysts to see that there is a potential problem. Hence, company managers, or investors can make the right decisions about a business if the relevant data provided from using profitability indicators are accurately analyzed.
Profitability indicators are also important as they are effective management tools that can be useful for planning future activities and interpreting financial activity outcomes during the decision-making process. By providing concrete and realistic information on the financial aspects of a company, profitability indicators are useful in decision-making for operations, maintaining efficiency, and future business stability.
In addition, with the aim of reducing risk, profit indicators can be used to encompass the profitability and growth of the company, and also value the efficiency of the company’s management. In this way, profitability indicators serve as indicators of whether the manager of the company is going in the right direction.
Last Updated on November 4, 2023 by Nansel Nanzip Bongdap
Obotu has 2+years of professional experience in the business and finance sector. Her expertise lies in marketing, economics, finance, biology, and literature. She enjoys writing in these fields to educate and share her wealth of knowledge and experience.